(i) GDP Data
1. GDP
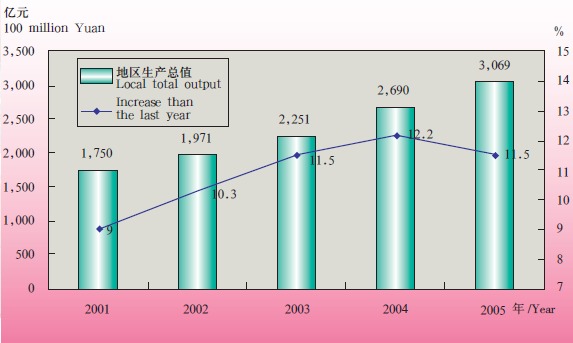
Local total output in 2005 was RMB 306.91 billion Yuan.
Industry Values of Chongqing from 2001 to 2005
2. Per capita GDP
The per capita GDP was R M B 10,978 Yuan in 2005 (equals to 1,340 USD according to the exchange rate at that time).
3. Proportion of industry, agriculture and service industry
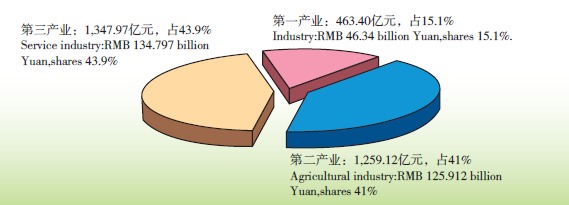
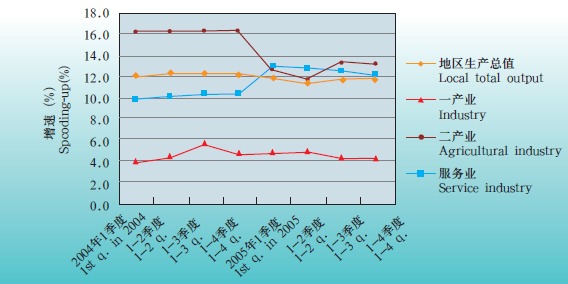
The Growth of Added Value of Three Industries in Chongqing (Data from monthly report)
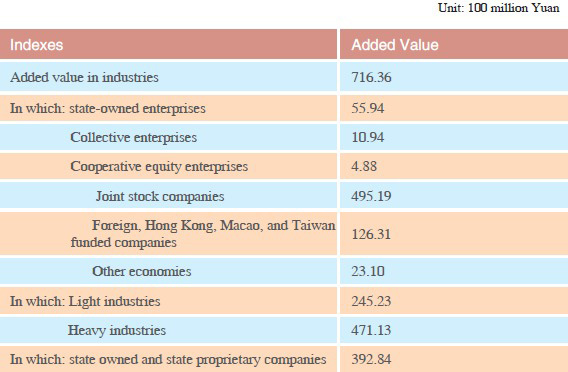
Main Categories of Added Value on Industries above Scale of Chongqing in 2005
(ii) Resources, Data of Industries, Social Service Industries, Agricultural, Forestry, Stock Raising and Fishery Industries, and Industries' Features and Main Products
1. Natural Resources
Land Resource


Forest Resource


Water Resource


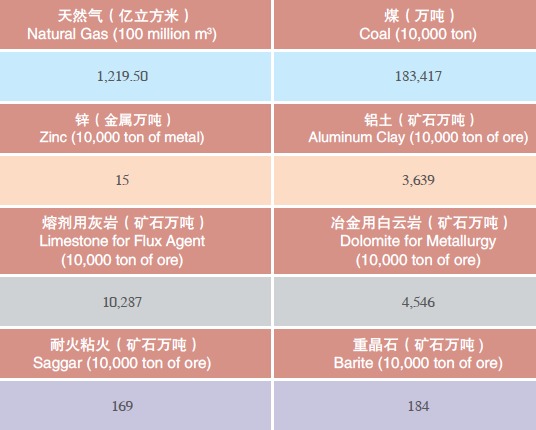
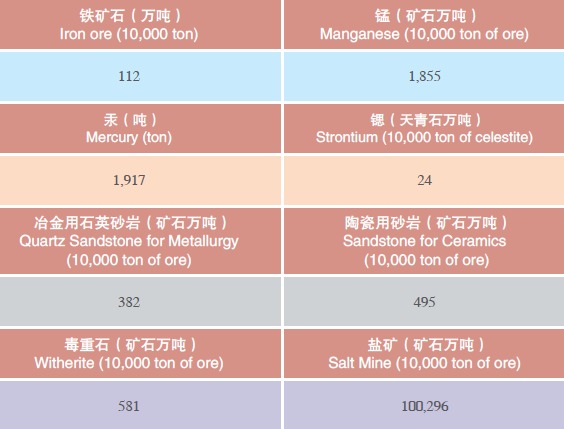
Main Mineral Resources (Basic Storage Retained)
2. Industry
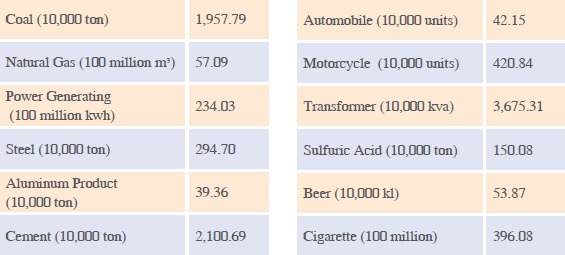
Output of Main Industrial Products
3. Service Industry
Service industry increased 134.736 billion Yuan in 2005. Share of service industry in local GDP is 43.9%, which holds the largest share among the three industries.
4. Agriculture


5. Features of Industries and Main Products
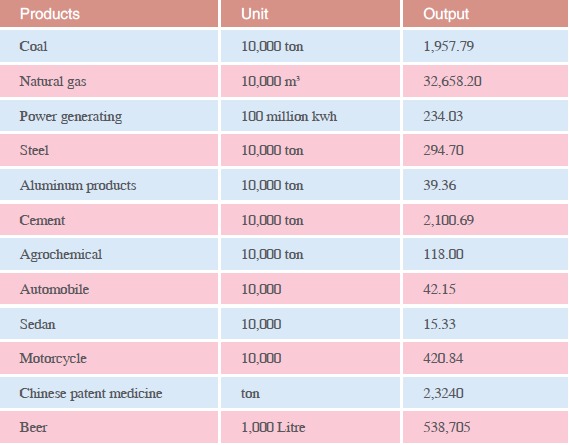
Chognqing is one of the six traditional industrial bases in China. It is an important mechanical industry base, general chemical industry base, medical industry base and instrumentation base (output of instrument and meter is only next to Shanghai) in China. It is also one of the major production bases of automobiles (Chang'an Group ranks forth in automobile industry of China) and motorcycles. Industries in Chongqing are mainly the heavy ones with complete types and strong abilities to provide auxiliary items. In the city there are mechanical industries based on automobiles and motorcycles and chemical industries focused on natural gas and medical industry. A group of predominant industries like metallurgy, mechanical and electrical equipments, electronic information, instrumentation, food processing, construction and construction materials, glassware and ceramics, etc.
Output of Major Industrial Products in Chongqing in 2005
(iii) Commerce Data
1. Import and Export
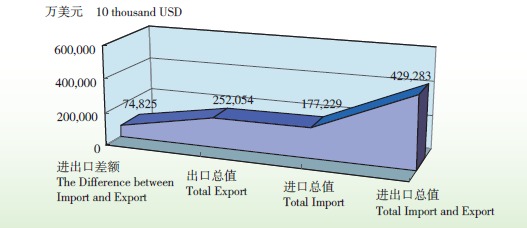
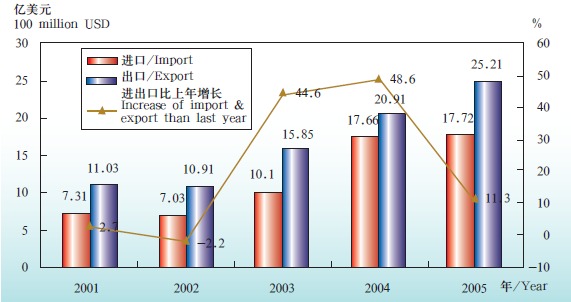
Total import and export volume of the year was 4.293 billion USD. The export was 2.521 billion USD, and the import was 1.772 billion USD. Export of electro-mechanical products was 1.566 billion USD, taking up 62.1% of the total export.
Import and Export in Chongqing from 2001 to 2005
2. Foreign Capital Utilization
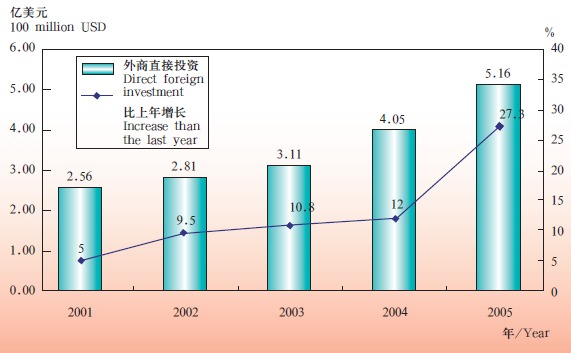
Contract amount for foreign capital was 819 million USD for the year. Actual foreign investment utilization was 516 million USD. Actual domestic capital utilization was RMB 20.59 billion Yuan.
Situations of Actual Foreign-investment Utilization in Chongqing from 2001 to 2005
Contract amount for foreign contracting projects, labors, and design consultations of the year were 185 million USD. Revenue from overseas labor cooperation was 121 million USD.


3. Foreign Contracted Project and Labor Cooperation

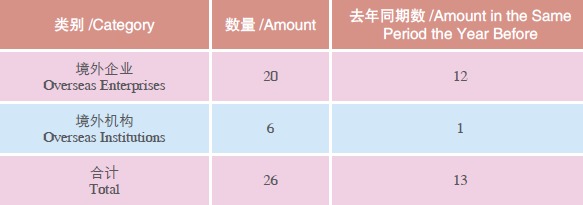
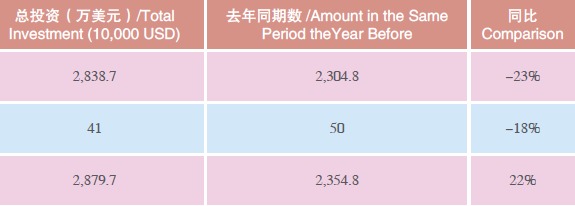
4. Investment to Foreign Countries
Statistics for Overseas Investment Project
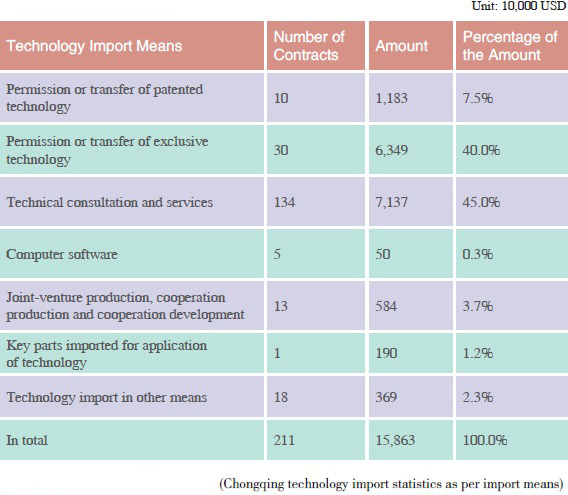
5. Technology Import
6. Commodity Circulation
Trading and distribution business developed rapidly. The market system was gradually completed. In the past years, some production materials and consumer goods markets of futures, spots, and retail products like Southwest Construction Material Market, Chaotianmen Market, etc. have been set up. All types of key material markets keep developing and consummating. A market network that serves upstream area of Yangtze River is coming into shape.
Related Articles:
Doing Business in Chongqing Municipality of China: Survey
Doing Business in Chongqing Municipality of China: Investment
Doing Business in Chongqing Municipality of China: Development Zones


