Industrial Profits from Principal Business Increased from January to July National Bureau of Statistics of China
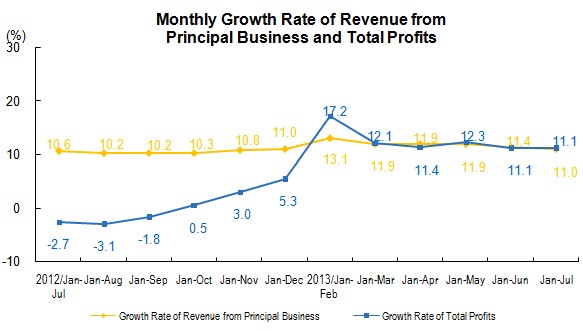
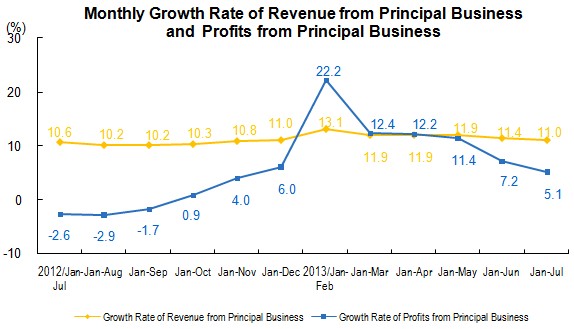
From January to July, the industrial profits of enterprises above designated size achieved 3,003.22 billion yuan, an increase of 11.1 percent over the same period last year, remained at the same level over the first six months, of which, the industrial profits from principal business achieved 3,134.68 billion yuan[1], an increase of 5.1 percent over the same period last year, 2.1 percentage points lower than that in the first six months.
In July, the industrial profits of enterprises above designated size achieved 4,195.5 billion yuan, an increase of 11.6 percent over the same period last year, up by 5.3 percentage points over the previous month. Of which, the industrial profits from principal business achieved 34.55 billion yuan, an increase of 1.8 percent over the same period last year, while the industrial profits from principal business in June decreased 2.3 percent over the same period last year.
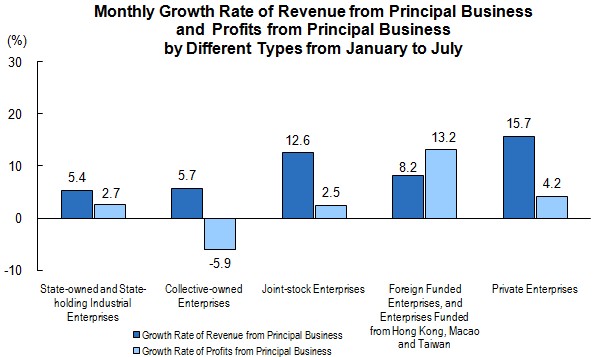
From January to July, the profits of state-owned and state-holding industrial enterprises above designated size gained 833.19 billion yuan, an increase of 5.5 percent over the same period last year, of which, the industrial profits from principal business achieved 728.51 billion yuan, an increase of 2.7 percent over the same period last year; that of collective-owned enterprises reached 43.06 billion yuan, increased 0.3 percent, of which, the industrial profits from principal business achieved 47.82 billion yuan, a decrease of 5.9 percent; that of joint-stock enterprises stood at 1,749.12 billion yuan, increased 9.2 percent, of which, the industrial profits from principal business achieved 1,843.87 billion yuan, an increase of 2.5 percent; that of foreign funded enterprises, and enterprises funded from Hong Kong, Macao and Taiwan achieved 698.78 billion yuan, increased 14.8 percent, of which, the industrial profits from principal business achieved 680.52 billion yuan, an increase of 13.2 percent; and that of private enterprises gained 943.93 billion yuan, increased 15.4 percent, of which, the industrial profits from principal business achieved 1,123.96 billion yuan, an increase of 4.2 percent.
From January to July, within 41 branches of industrial divisions, the industrial profits from principal business of 27 industrial divisions increased over the same period last year, that of 11 declined, 2 industries turned to get net profits from loss, and the loss of 1 industry decreased over the same period last year.
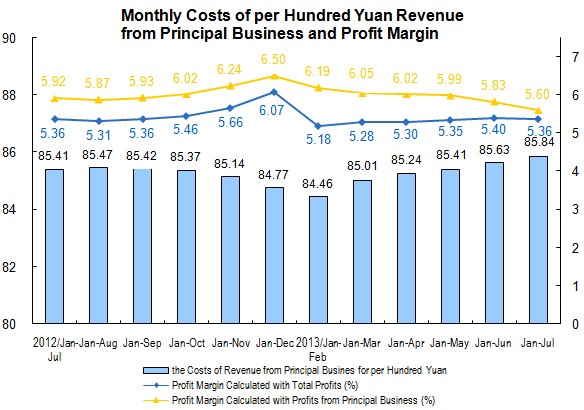
From January to July, the revenue from principal business of enterprises above designated reached 55,997.48 billion yuan, increased 11.0 percent over the same period last year. The cost of main business revenue for per hundred yuan stood at 85.84 yuan, with the profit margin hit 5.36 percent when calculated with total profits, and 5.60 percent when calculated with profits from principal business.
From January to July, the revenue from principal business of state-owned and state-holding industrial enterprises grew to 14,340.44 billion yuan, increased 5.4 percent over the same period last year, the costs of revenue from principal business for per hundred yuan stood at 82.85 yuan, with the profit margin (calculated with profits from principal business, similarly hereinafter) hit 5.08 percent; that of collective-owned enterprises reached 651.79 billion yuan, increased 5.7 percent, the costs of revenue from principal business for per hundred yuan stood at 85.95 yuan, with the margin hit 7.34 percent; that of joint-stock enterprises reached 32,923,01 billion yuan, increased 12.6 percent, the costs of revenue from principal business for per hundred yuan stood at 85.71 yuan, with the margin hit 5.60 percent, that of foreign funded enterprises, and enterprises funded from Hong Kong, Macao and Taiwan achieved 13,331.15 billion yuan, increased 8.2 percent, the costs of revenue from principal business for per hundred yuan stood at 86.41 yuan, with the margin hit 5.10 percent; and that of private enterprises gained 17,583.29 billion yuan, increased 15.7 percent, the costs of revenue from principal business for per hundred yuan stood at 87.25 yuan, with the margin hit 6.39 percent.
By the end of July, the total volume of receivable accounts for industrial enterprises hit 8,981.89 billion yuan, went up by 12.7 percent over the same period last year. The total value of finished products for industrial enterprises accounted for 3,167.4 billion yuan, went up by 6.1 percent over the same period last year.
Key Financial Indicators of Industrial Enterprises
above Designated Size from January to July
| Indicators | Revenue from | Total Profits | Profits from Principal Business | ||||
| Principal Business | |||||||
| Accumulated to July (100 million yuan) | Increase rate Y/Y | Accumulated to July (100 million yuan) | Increase rate Y/Y | Accumulated to July (100 million yuan) | Increase rate Y/Y | ||
| (%) | (%) | (%) | |||||
| Industrial Enterprises above Designated Size | 559974.8 | 11 | 30032.2 | 11.1 | 31346.8 | 5.1 | |
| Grouped by Status of Registration 1 | |||||||
| State Owned & State-Holding Enterprises | 143404.4 | 5.4 | 8331.9 | 5.5 | 7285.1 | 2.7 | |
| Private Enterprises | 175832.9 | 15.7 | 9439.3 | 15.4 | 11239.6 | 4.2 | |
| Collective-owned Enterprises | 6517.9 | 5.7 | 430.6 | 0.3 | 478.2 | -5.9 | |
| Joint-Stock Enterprises | 329230.1 | 12.6 | 17491.2 | 9.2 | 18438.7 | 2.5 | |
| Enterprises with Funds From Hong Kong, Macao and Taiwan, and Foreign Funded Enterprises | 133311.5 | 8.2 | 6987.8 | 14.8 | 6805.2 | 13.2 | |
| Grouped by Industries | |||||||
| Mining and Washing of Coal | 18471.5 | -1.5 | 1193.2 | -43.8 | 1227.5 | -43.9 | |
| Extraction of Petroleum and Natural Gas | 6613.4 | 1 | 2310.5 | -8.4 | 2431.8 | -9.5 | |
| Mining of Ferrous Metal Ores | 5128.4 | 12 | 456.8 | -7.2 | 494.4 | -4.5 | |
| Mining of Non-Ferrous Metal Ores | 3263.9 | 11 | 342.4 | -9.9 | 365.8 | -12.7 | |
| Mining And Processing of Nonmetal Ores | 2551.8 | 14.8 | 177.9 | 12.5 | 222.6 | -6.7 | |
| Processing of Food From Agricultural Products | 31752.3 | 14.6 | 1383.2 | 10.1 | 1701.4 | 6 | |
| Manufacture of Foods | 9786.3 | 16.5 | 757.2 | 19.2 | 812.6 | 11.2 | |
| Manufacture of Wines, Beverage and Refined Tea | 8416.9 | 12.7 | 859.9 | 11.5 | 893.5 | 5.4 | |
| Manufacture of Cigarettes And Tobacco | 5080.1 | 10.1 | 806.6 | 16 | 784.9 | 14.9 | |
| Manufacture of Textile | 19537.3 | 13.3 | 925.3 | 17.9 | 1051.8 | 3.3 | |
| Manufacture of Textile Wearing Apparel And Ornament | 10184.2 | 11.2 | 521.2 | 10.9 | 583 | 0.2 | |
| Manufacture of Leather, Fur, Feather and Its Products | 6813.8 | 11.4 | 393.6 | 11.9 | 452.6 | 2.9 | |
| Processing of Timbers, Manufacture of Wood, Bamboo, Rattan, Palm, and Straw Products | 6360 | 18.8 | 363.5 | 24.1 | 435 | 8.1 | |
| Manufacture of Furniture | 3406.1 | 12.2 | 181.5 | 16.6 | 204.5 | 1.4 | |
| Manufacture of Paper and Paper Products | 7483.6 | 8.6 | 346.3 | 13.5 | 364 | 5.9 | |
| Printing, Reproduction of Recording Media | 2782.5 | 13.5 | 198.2 | 11.9 | 204.2 | 7.5 | |
| Manufacture of Articles for Culture, Education, Artwork, Sport and Entertainment Activity | 6456.7 | 15.7 | 275.6 | 10.7 | 314.3 | 3.6 | |
| Processing of Petroleum, Coking, Processing of Nucleus Fuel | 22950.1 | 2.9 | 112.4 | (Note 2) | 122.4 | (Note 3) | |
| Manufacture of Chemical Raw Material and Chemical Products | 41567.2 | 12.8 | 1858.3 | 8.4 | 2021.4 | 1.7 | |
| Manufacture of Medicines | 11088 | 19.2 | 1062.1 | 16.9 | 1073.5 | 11.6 | |
| Manufacture of Chemical Fibres | 4066.2 | 10.4 | 100.4 | 19.3 | 88.9 | 30.8 | |
| Manufacture of Rubber and Plastics Products | 14711.4 | 13 | 826.6 | 21.2 | 913.1 | 10.6 | |
| Manufacture of Non-Metallic Mineral Products | 27108.6 | 15.7 | 1684 | 19.1 | 1899.2 | 10 | |
| Manufacture and Processing of Ferrous Metals | 43160.5 | 5.9 | 506.1 | 27.9 | 592.2 | 26 | |
| Manufacture and Processing of Non-Ferrous Metals | 25397 | 13.2 | 548.4 | -10.4 | 656 | -19.2 | |
| Manufacture of Fabricated Metal Products | 17527.4 | 13.7 | 822.5 | 17.5 | 939.8 | 6.8 | |
| Manufacture of General-Purpose Machinery | 23161.9 | 11.1 | 1398.3 | 11 | 1524.2 | 4.7 | |
| Manufacture of Special-Purpose Machinery | 17240.6 | 10.5 | 1057.9 | 2.1 | 1091.4 | -4.3 | |
| Manufacture of Motor Vehicles | 33016.4 | 15.5 | 2692 | 19.7 | 2209 | 10.2 | |
| Manufacture of Railway Locomotives, Building of Ships and Boats, Manufacture of Air and Spacecrafts and Other Transportation Equipments | 8448 | 0.9 | 391.8 | -2.8 | 422.7 | -1.7 | |
| Manufacture of Electrical Machinery and Equipment | 32814.5 | 12.5 | 1515.6 | 11.3 | 1598.7 | 5.5 | |
| Manufacture of Computer, Communication Equipment and Other Electronic Equipment | 41513.4 | 11.7 | 1313.1 | 29 | 1330 | 25.8 | |
| Manufacture of Measuring Instrument and Meter | 4071.4 | 16.6 | 296.8 | 9.9 | 277.8 | 3.8 | |
| Production and Supply of Electric Power and Heat Power | 30645 | 7 | 1968.4 | 73.5 | 1742.7 | 91.2 | |
| Production and Distribution of Gas | 2185.6 | 16.6 | 200.9 | 20.8 | 155.8 | 22.1 | |
| Production and Distribution of Water | 782.9 | 12.7 | 36.4 | 148.5 | -8.2 | (Note 4) | |
Note:
1. Due to the overlap of economic type grouping, the total is not equal to the total of sub-items.
2. The total profits of processing of petroleum, coking, processing of nucleus fuel of the same period last year reached -34.04 billion yuan.
3. The profits from principal business of processing of petroleum, coking, processing of nucleus fuel of the same period last year reached -33.04 billion yuan.
4. The profits from principal business of production and distribution of water of the same period last year reached -1.80 billion yuan.
Annotations:
1. Explanatory Notes:
Total Profits: refer to the final achievement of production and operation activities of the enterprises, represented by total profits after deducting losses (loss is expressed by the negative figure).
Profits from principal business = Revenue from principal business – Cost of principal business – Tax and extra charges of principal business – Selling expenses – Administrative expenses – Financial expenses
Revenue from Principal Business: refers to total income of enterprises gained from principal business operation.
Receivable Accounts: refers to the funds received by enterprises from units purchasing goods or receiving labor services through selling goods, products, proving labor services and etc.
Finished Goods: refers to manufactured products which are ready for sale by the end of report period.
The costs of revenue from principal business for per hundred yuan = The cost of revenue from principal business / The revenue from principal business×100
Profit margin calculated with total profits = Total profits/The revenue from principal business×100%
Profit margin calculated with profits from principal business = Profits from principal business / The revenue from principal business×100%
2. Statistical Coverage
Since 2011, enterprises above designated size refers to all industrial enterprises with revenue from principal business over 20 million yuan (the former is 5 million yuan).
3. Data Collection
Since 2011, the Financial Report of Enterprises Above Designated Size conducts complete survey by month (the data on January are not required to report).
4. Standard Industrial Classification
Since 2012, the new Industrial Classification for National Economic Activities (GB/T 4754-2011) was implemented by NBS, the industrial divisions were expanded to 41 from 39.
[1]Note: From May 2013, the indicator of profits from principal business is added under the total profits. Profits from principal business = revenue from principal business – cost of principal business – tax and extra charges of principal business – selling expenses – administrative expenses – financial expenses. The indicator of profits from principal business has a closer relationship with industrial production, and can better reflect the operating results of industrial production activities.


 Passenger Auto Folding Lightweight Mobility Scooter with CE")

