2010-2014 Countries/Regions that China Exported to (Unit: Thousand Million USD)
| 2010 | 2011 | 2012 | 2013 | 2014 | |
| Total | 15777.54 | 18983.81 | 20487.14 | 22100.19 | 23427.47 |
| Asia | 7320.66 | 8991.42 | 10069.63 | 11347.06 | 11886.36 |
| Japan | 1210.61 | 1482.98 | 1516.43 | 1502.75 | 1494.42 |
| Republic of Korea | 687.71 | 829.24 | 876.81 | 911.76 | 1003.40 |
| China Hongkong | 2183.17 | 2680.25 | 3235.27 | 3847.92 | 3631.91 |
| China Taiwan | 296.77 | 351.12 | 367.79 | 406.44 | 462.85 |
| ASEAN * | 1382.07 | 1700.83 | 2042.72 | 2440.70 | 2720.71 |
| Singapore | 323.48 | 355.70 | 407.52 | 458.64 | 489.15 |
| Africa | 599.58 | 730.99 | 853.20 | 928.09 | 1061.47 |
| Europe | 3552.04 | 4136.16 | 3964.24 | 4057.75 | 4388.69 |
| EU** | 3112.35 | 3560.20 | 3339.89 | 3389.85 | 3708.84 |
| United Kingdom | 387.71 | 441.25 | 462.99 | 509.49 | 571.43 |
| Germany | 680.47 | 764.35 | 692.18 | 673.48 | 727.12 |
| France | 276.54 | 299.97 | 269.00 | 267.19 | 287.08 |
| Italy | 311.41 | 336.98 | 256.57 | 257.56 | 287.58 |
| Netherlands | 497.06 | 595.00 | 589.04 | 603.17 | 649.31 |
| Russia | 296.13 | 389.04 | 440.58 | 495.95 | 536.78 |
| Latin America | 918.21 | 1217.31 | 1352.17 | 1342.71 | 1362.35 |
| North America | 3058.61 | 3501.17 | 3801.30 | 3978.38 | 4262.78 |
| Canana | 222.17 | 252.68 | 281.26 | 292.19 | 300.06 |
| United States | 2833.04 | 3244.93 | 3517.96 | 3684.27 | 3960.82 |
| Oceanica | 330.23 | 408.95 | 448.80 | 446.20 | 465.82 |
| Australia | 272.26 | 339.10 | 377.40 | 375.60 | 391.54 |
Note:
* ASEAN: Indonesia, Malaysia, the Philippines, Singapore, Thailand, Brunei, Cambodia, Laos, Myanmar (Burma), and Vietnam
**EU: Austria, Belgium, Bulgaria, Croatia, Cyprus, Czech Republic, Denmark, Estonia, Finland, France, Germany, Greece, Hungary, Ireland, Italy, Latvia, Lithuania, Luxembourg, Malta, Netherlands, Poland, Portugal, Romania, Slovakia, Slovenia, Spain, Sweden
2014 China Export Markets Analysis (by Continent)
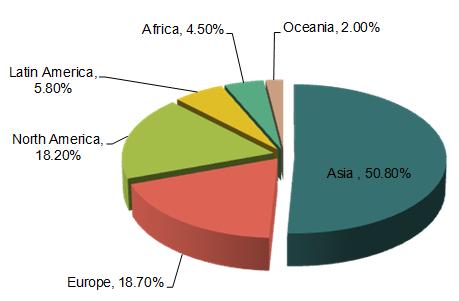
In 2014, the percentages of China export sales to Asia, Europe, North America, Latin America, Africa, and Oceania are 50.8%, 18.7%, 18.2%, 5.8%, 4.5%, and 2%. Asia is the most important export market for China. In 2014, above 50% Chinese products are exported to Asia. The export sales to Asia increases by 4.8% in 2014, a little lower than 6.1% growth rate of the China annual export sales. Meanwhile, the export sale to Africa is 105.96 billion USD, which increases by 14.4%. The growth rates of export sales to Europe, North America, and Africa are higher than that of China total export sales, while the growth rates of export sales to Asia, Latin America, and Oceania are lower.
2014 China Export Markets Analysis (by Country)
| No. | Country/Region | Export Sales (Thousand USD) | YoY | Ratio |
| 1 | United States of America | 397,150,820 | 7.6% | 17.0% |
| 2 | Hong Kong, China | 363,183,413 | -5.5% | 15.5% |
| 3 | Japan | 149,557,998 | -0.4% | 6.4% |
| 4 | Korea, Republic of | 100,361,732 | 10.1% | 4.3% |
| 5 | Germany | 72,723,320 | 8.0% | 3.1% |
| 6 | Netherlands | 64,935,992 | 7.7% | 2.8% |
| 7 | Viet Nam | 63,611,359 | 30.9% | 2.7% |
| 8 | United Kingdom | 57,156,520 | 12.2% | 2.4% |
| 9 | India | 54,236,745 | 12.0% | 2.3% |
| 10 | Russian Federation | 53,685,970 | 8.3% | 2.3% |
| 11 | Singapore | 48,851,743 | 6.6% | 2.1% |
| 12 | Taipei, Chinese | 46,292,158 | 13.9% | 2.0% |
| 13 | Malaysia | 46,284,664 | 0.8% | 2.0% |
| 14 | Australia | 39,120,589 | 4.2% | 1.7% |
| 15 | Indonesia | 39,066,097 | 5.8% | 1.7% |
| 16 | United Arab Emirates | 39,042,019 | 16.9% | 1.7% |
| 17 | Brazil | 34,915,140 | -2.7% | 1.5% |
| 18 | Thailand | 34,307,809 | 4.9% | 1.5% |
| 19 | Mexico | 32,260,183 | 11.4% | 1.4% |
| 20 | Canada | 30,008,343 | 2.7% | 1.3% |
The top 10 countries/regions that China exported products to in 2014 are the United States, Hongkong, Japan, Republic of Korea, Germany, Netherlands, Vietnam, United Kingdom, India, and Russia. The sum of export sales to top 10 countries/regions occupies 58.8% of China annual export sales. The United States and Hongkong are the top 2 export markets for China. To be specific, the export sales to the United States and Hongkong are 397.15 billion USD and 363.19 billion USD in 2014, which occupy 17% and 15.5% of China export sales respectively.
2014 China Export Countries/Regions in Asia
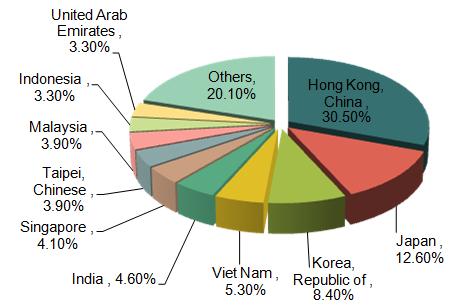
In 2014, the top Asia countries/regions that China exported products to are Hongkong, Japan, Republic of Korea, and Vietnam, among which the export sales to Hongkong occupies one third of the total China export sales to Asia. In recent five years, the export sales to Vietnam are increasing continuously while the export sales to Japan are decreasing.
2014 China Export Countries/Regions in Europe
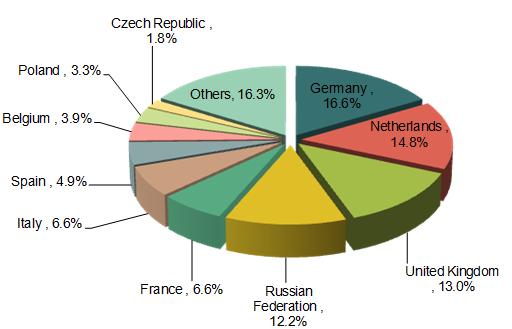
The top 4 European countries/regions that China exported products to in 2014 are Germany, Netherland, United Kingdom, and Russia. The percentages of export sales to these countries are 16.6%, 14.8%, 13%, and 12.2% of the total export sales to Europe, in total 56.7%. Compared with that in 2013, the export sales to Europe are decreasing. In recent five years, the percentage of China export sales to Russia to the total China export sales is increasing continuously while the export sales percentages to Germany, United Kingdom, France, Spain, and Italy are decreasing.
2014 China Export Countries/Regions in North America
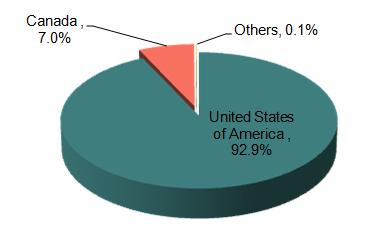
In 2014, top 2 countries in North America that China exported products to in 2014 are the United States and Canada. The percentage of China export sales to the United States to the total China export sales to North America is 92.9%, while the percentage of China export sales to Canada is 7%.
2014 China Export Countries/Regions in Latin America
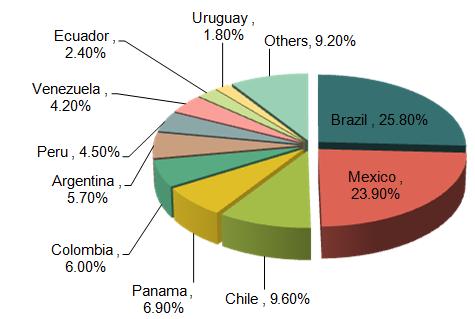
In 2014, the China export sales to Latin America are 135.168 billion USD, which is increasing by 1.5%. The top 2 countries in Latin America that China exported products to in 2014 are Brazil and Mexico. The percentage of China export sales to the Brazil to the total China export sales to Latin America is 25.8%, while the percentage of China export sales to Canada is 23.9%.
2014 China Export Countries/Regions in Africa
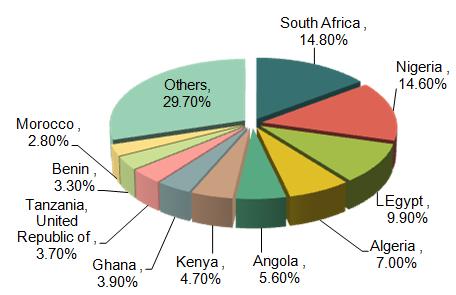
In 2014, the China export sale to Africa is 105.96 billion USD. The top 2 countries in Africa that China exported products to in 2014 are South Africa and Nigeria. The percentage of China export sales to the South Africa to the total China export sales to Africa is 14.8%, while the percentage of China export sales to Nigeria is 14.6%.
2014 China Export Countries/Regions in Oceania
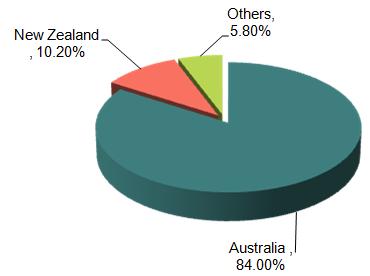
In 2014, the China export sale to Oceania is 46.55 billion USD, which is increasing by 4.3% and occupies 2% of the China annual export sales. The top 2 countries in Oceania that China exported products to in 2014 are Australia and New Zealand. The percentage of China export sales to the Australia to the total China export sales to Oceania is 84%, while the percentage of China export sales to New Zealand is 10.2%.


