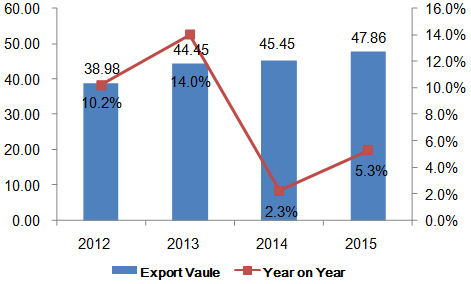
Annual Export Trends of China's Headgear & Parts

China's headgear & parts export has trended down since 2013 during the period from 2012 to 2015. The export value in 2015 was USD 4,786,000,000, growing 22.8% on year.
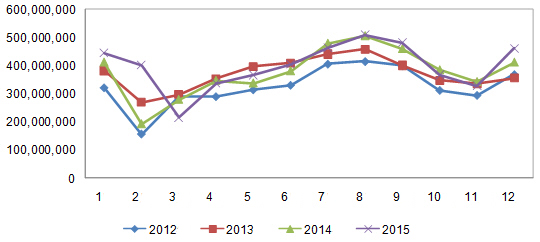
Monthly Export Trends of China's Headgear & Parts

According to the chart above, from 2012 to 2015, China's headgear & parts export surged in August. In 2015, exports peak was in August and trough was in March.
China's Headgear & Parts Export Volume & Value in 2015
| Month | Volume | Value(USD) | on Year | |
| Volume | Value | |||
| January | 937,807,760 | 445,662,066 | -7.50% | 7.90% |
| February | 813,554,649 | 401,737,446 | 51% | 107.60% |
| March | 436,443,184 | 216,926,748 | -31.30% | -22.70% |
| April | 827,669,475 | 337,800,650 | -7.70% | -3% |
| May | 910,909,587 | 367,365,035 | -1% | 8.60% |
| June | 882,782,783 | 405,380,614 | 4.90% | 6.30% |
| July | 1,015,418,378 | 462,867,172 | 12.70% | -3.50% |
| August | 1,024,981,795 | 508,941,814 | 10.30% | 0.50% |
| September | 949,224,860 | 481,614,365 | 9.40% | 4.60% |
| October | 825,054,069 | 367,866,468 | 1.10% | -4.60% |
| November | 823,551,748 | 328,690,311 | -4.90% | -4.40% |
| December | 945,166,444 | 461,574,590 | 4.10% | 11.90% |
| Total | 10,392,564,732 | 4,786,427,279 | 2.50% | 5.30% |
From January to December in 2015, China's headgear & parts export value reached USD 4,786,427,279, falling 8.9% on year.
Export Destinations for China's Headgear & Parts in 2015
| No. | Country/Region | Volume | Value(USD) | on Year | |
| Volume | Value | ||||
| 1 | United States | 3,086,255,077 | 1,280,773,234 | 13.80% | 14.70% |
| 2 | Japan | 405,385,969 | 292,348,403 | 10.30% | 0.90% |
| 3 | Germany | 458,648,156 | 216,135,548 | -1.40% | -5.30% |
| 4 | United Kingdom | 530,076,459 | 207,770,593 | 1.30% | 6.60% |
| 5 | Hong Kong | 235,082,589 | 176,516,054 | -33.50% | 8.20% |
| 6 | Korea | 98,363,711 | 171,210,086 | 2.60% | 40.50% |
| 7 | Russia | 131,199,543 | 168,803,335 | -31.60% | -48.20% |
| 8 | Spain | 212,298,449 | 124,641,394 | 6.30% | 22.80% |
| 9 | Canada | 260,380,793 | 123,792,128 | 9.90% | 6% |
| 10 | Mexico | 236,698,813 | 119,968,618 | 12.40% | 20% |
| 11 | Australia | 191,459,606 | 113,524,472 | 10.20% | 17.30% |
| 12 | Netherland | 276,940,884 | 109,868,692 | -6.80% | -7.80% |
| 13 | France | 359,173,245 | 109,781,473 | 4.20% | -17.80% |
| 14 | Italy | 168,065,888 | 105,818,322 | -1.90% | -1.20% |
| 15 | Belgium | 220,780,141 | 93,423,316 | -0.40% | 15.20% |
| 16 | South Africa | 329,067,514 | 85,668,164 | 10.10% | 36.30% |
| 17 | United Arab Emirates | 269,077,364 | 84,864,523 | 3.70% | 35.10% |
| 18 | Brazil | 646,873,222 | 70,695,100 | -4.70% | -4.70% |
| 19 | India | 72,433,336 | 58,879,684 | -35.30% | 52.30% |
| 20 | Malaysia | 117,522,642 | 55,447,119 | 4% | 15.20% |

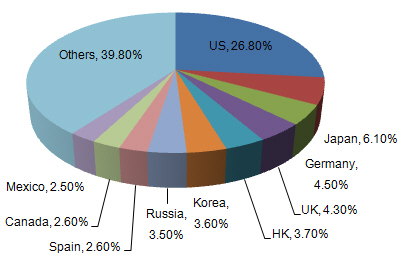
From January to December in 2015, the top export destinations of China's headgear & parts were the United States, Japan, Germany, United Kingdom and Hong Kong. In 2015, China exports to India grew faster than exports to other markets and the growth was 52.3% on year.
Export Origins of China's Headgear & Parts
| No. | District | Volume | Value(USD) | on Year | |
| Volume | Value | ||||
| 1 | Zhejiang | 1,042,511,617 | 1,365,306,148 | -6% | 23.80% |
| 2 | Guangdong | 1,369,274,902 | 1,026,291,171 | -10.10% | -4.30% |
| 3 | Jiangsu | 1,036,845,975 | 904,155,111 | 6.40% | 4.90% |
| 4 | Shanghai | 311,032,931 | 381,611,920 | -7.40% | -8% |
| 5 | Shandong | 468,731,503 | 352,500,982 | 12.60% | 13.60% |
| 6 | Hebei | 157,145,209 | 124,685,521 | 14.70% | 19.90% |
| 7 | Fujian | 39,621,415 | 95,064,266 | -10.90% | -4.40% |
| 8 | Hubei | 5,548,317,729 | 92,162,664 | 7.50% | 4.20% |
| 9 | Heilongjiang | 28,406,698 | 86,255,411 | -32.20% | -56.60% |
| 10 | Beijing | 7,684,659 | 77,098,194 | 21.80% | 91.20% |
| 11 | Henan | 43,830,371 | 41,665,762 | 22.90% | 27.50% |
| 12 | Jiangxi | 32,598,115 | 40,294,616 | 33.50% | 121.60% |
| 13 | Liaoning | 21,883,120 | 34,413,501 | 37.80% | 5.60% |
| 14 | Xinjiang | 14,329,038 | 25,143,552 | -36.30% | -30.20% |
| 15 | Chongqing | 10,456,247 | 23,069,720 | 86.50% | 169.90% |
| 16 | Anhui | 204,426,975 | 17,692,135 | -1.60% | 8.90% |
| 17 | Tianjin | 9,339,323 | 17,564,618 | -13.90% | -20.10% |
| 18 | Qinghai | 13,241,822 | 13,608,089 | 13.50% | 136.60% |
| 19 | Guizhou | 5,138,445 | 13,525,763 | 0.70% | 69.40% |
| 20 | Yunan | 4,139,796 | 11,136,673 | 14.90% | -28.60% |
The top export origins of China's headgear & parts were Guangdong, Zhejiang, Jiangsu province in 2015. Zhejiang province exported USD 1,365,306,148, making the largest export origins in China. The average export price for headgear & parts from Beijing was the highest (USD 10.03 per).


