Annual Trend of China's Carpets & Textile Floor Coverings Export Value from 2012 to 2015
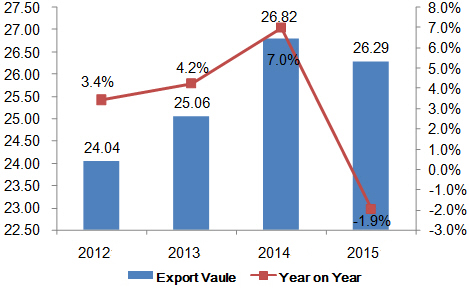
From 2012 to 2015, China's carpets & textile floor coverings export value trended up. The export value in 2015 was USD 2,629,000,000, growing 9.4% from 2012.
Monthly Trend of China's Carpets & Textile Floor Coverings Export Value from 2012 to 2015

China's carpets & textile floor coverings export value peaks were dispersal during the period from 2012 to 2015. In 2015, the export value peaked in May and hit a trough in March.
China's Carpets & Textile Floor Coverings Export Volume & Value in 2015
| Month | Volume(kg) | Value(USD) | on Year | |
| Volume | Value | |||
| 1 | 56,368,303 | 241,766,745 | -1.90% | -0.50% |
| 2 | 47,455,095 | 204,646,844 | 82.40% | 100.70% |
| 3 | 35,468,421 | 144,432,357 | -22.60% | -22.80% |
| 4 | 54,941,654 | 218,118,677 | -3.70% | -8.70% |
| 5 | 59,090,451 | 238,349,293 | 2.40% | 1.50% |
| 6 | 57,514,613 | 233,654,406 | 11.20% | 8.60% |
| 7 | 57,098,399 | 226,596,166 | -2.20% | -7.30% |
| 8 | 53,918,610 | 217,534,211 | -5.80% | -10.70% |
| 9 | 56,932,570 | 237,425,915 | 3.10% | -1.20% |
| 10 | 54,393,866 | 218,003,766 | -0.50% | -7.60% |
| 11 | 50,914,789 | 214,449,151 | -6.10% | -9.20% |
| 12 | 59,168,907 | 234,517,856 | 3.60% | -9.60% |
| Total | 643,265,678 | 2,629,495,387 | 1.70% | -1.90% |
China's carpets & textile floor coverings export value reached USD 2,629,000,000 in 2015, falling 1.9% on year.
Markets for China's Carpets & Textile Floor Coverings Exports in 2015
| No. | Country/Region | Volume(kg) | Value(USD) | on Year | |
| Volume | Value | ||||
| 1 | United States | 125,244,450 | 519,995,303 | 8.80% | 3.10% |
| 2 | Japan | 62,502,268 | 325,807,495 | -10.20% | -14.70% |
| 3 | Malaysia | 25,774,905 | 121,771,360 | -1.60% | -0.10% |
| 4 | Australia | 32,846,694 | 119,417,192 | 17.20% | 12.70% |
| 5 | Saudi Arabia | 29,473,044 | 93,755,003 | 33.20% | 29% |
| 6 | United Kingdom | 22,826,278 | 80,896,151 | 9.10% | 7.80% |
| 7 | Germany | 18,367,257 | 79,914,365 | -0.60% | -1.70% |
| 8 | Korea | 12,350,753 | 65,141,268 | -2.20% | 6.70% |
| 9 | Vietnam | 15,284,860 | 65,031,709 | 23.10% | 11.20% |
| 10 | Hong Kong | 10,281,700 | 57,581,490 | -4.40% | -17.50% |
| 11 | India | 13,633,161 | 53,064,730 | 14.10% | 25.90% |
| 12 | United Arab Emirates | 12,782,191 | 51,147,506 | -0.50% | -6% |
| 13 | Brazil | 12,822,015 | 48,807,952 | -26% | -27.70% |
| 14 | Thailand | 10,265,144 | 46,115,640 | 3.70% | -7.90% |
| 15 | Canada | 15,919,731 | 45,317,839 | -13.40% | -17.40% |
| 16 | France | 10,609,420 | 43,394,026 | -3.80% | -0.40% |
| 17 | Singapore | 9,137,633 | 43,189,717 | -14.10% | -10.60% |
| 18 | Egypt | 16,388,298 | 41,853,549 | 81.30% | 45.70% |
| 19 | Netherland | 10,267,685 | 36,261,341 | -2.10% | -9% |
| 20 | Taiwan | 8,136,024 | 34,756,787 | -9.70% | 2.70% |
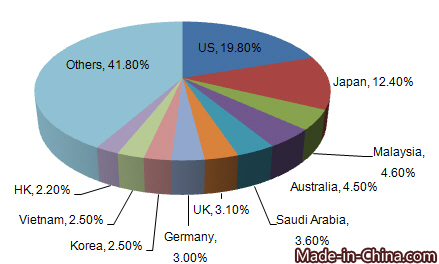
Major markets for China's carpets & textile floor coverings export included Japan, Australia, Germany, Vietnam, etc in 2015. The United States and Japan were major markets for China's carpets & textile floor coverings export. China's carpets & textile floor coverings exports to the United States grew 8.8% in 2015 on year and it accounted for 19.8% of China's total carpets & textile floor coverings export. From January to December in 2015, China's carpets & textile floor coverings exports to Egypt grew 43.5% on year.
China's Carpets & Textile Floor Coverings Export Origins in 2015
| No. | Districts | Volume(kg) | Value(kg) | on Year | |
| Volume | Value | ||||
| 1 | Jiangsu | 184,300,364 | 629,134,315 | 8.30% | 0.80% |
| 2 | Zhejiang | 137,670,922 | 525,830,600 | -0.70% | -1.60% |
| 3 | Shandong | 107,983,871 | 393,685,466 | 2% | -0.50% |
| 4 | Guangdong | 51,405,222 | 367,719,352 | -1.10% | 8.80% |
| 5 | Tianjin | 74,050,740 | 316,777,328 | -0.40% | -6.90% |
| 6 | Shanghai | 31,067,865 | 147,864,884 | -0.60% | -6.80% |
| 7 | Hebei | 19,877,301 | 81,482,869 | -0.10% | -7% |
| 8 | Jiangxi | 11,327,008 | 34,509,766 | 7.50% | 20.80% |
| 9 | Fujian | 4,465,868 | 20,468,175 | -6.60% | -17.70% |
| 10 | Henan | 1,084,266 | 19,804,316 | -12.40% | -36.20% |
| 11 | Beijing | 4,236,973 | 18,656,790 | -42.70% | -51.70% |
| 12 | Qinghai | 4,608,739 | 18,609,118 | 55.70% | 21.20% |
| 13 | Chongqing | 1,326,258 | 10,538,172 | 80.50% | 44.70% |
| 14 | Xinjiang | 1,340,632 | 8,301,176 | -15.40% | -26.70% |
| 15 | Anhui | 2,363,142 | 7,267,899 | -24.90% | -21.40% |
| 16 | Hubei | 859,000 | 4,997,556 | 36.30% | 58.10% |
| 17 | Inner Mongolia | 1,147,726 | 4,791,798 | -23.50% | -23.50% |
| 18 | Liaoning | 1,714,294 | 4,759,475 | -40.90% | -37.80% |
| 19 | Sichuan | 112,098 | 2,369,008 | -39.60% | -24.20% |
| 20 | Gansu | 181,639 | 2,342,233 | 340.10% | 178.50% |
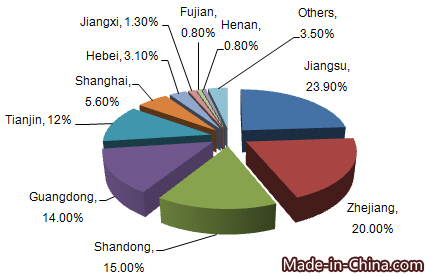
Zhejiang, Shandong and Jiangsu were China's major carpets & textile floor coverings export origins. In 2015, their silk export value accounted for 74.8% of China's total. In China's top 20 export origins, Gansu's carpets & textile floor coverings export value grew 1228.3% on year. Sichuan owned the highest export price (USD 21.13 per) and Liaoning owned the lowest (USD 2.78 per).


