Distribution of China Iron & Steel Structures (Rods, Angle, Plates) Export Enterprise
| No. | Region | Export Value | Y-o-Y | ||
| Volume(kg) | Value(USD) | Volume | Value | ||
| 1 | Guangdong | 638,282,441 | 1,936,126,071 | 22.60% | 52% |
| 2 | Jiangsu | 1,202,759,619 | 1,725,245,823 | 3.80% | -0.60% |
| 3 | Shandong | 988,560,536 | 1,502,569,391 | 11.90% | 9.40% |
| 4 | Zhejiang | 549,864,714 | 918,870,746 | -9.80% | -15.70% |
| 5 | Shanghai | 424,400,500 | 752,416,332 | 11.80% | -3.90% |
| 6 | Liaoning | 443,430,585 | 662,494,558 | 5.30% | -13.80% |
| 7 | Hebei | 382,416,725 | 478,898,768 | 33.80% | 29.50% |
| 8 | Tianjin | 312,991,561 | 376,013,670 | 30% | 13.90% |
| 9 | Beijing | 153,757,288 | 281,513,649 | 27.80% | 1.50% |
| 10 | Fujian | 125,856,961 | 207,533,782 | 49.40% | 39.50% |
From January to October, Guangdong, Jiangsu, Shandong were main regions where China’s iron & steel structures (rods, angle, plates) export enterprises located, The three regions’ total export value accounted for 52.4% of the total.
Distributions of Major Countries/Regions for China’s Iron & Steel Structures (Rods, Angle, Plates) Export
| No. | Country/Region | Export Value | Y-o-Y | ||
| Volume(kg) | Value(USD) | Volume | Value | ||
| 1 | Japan | 615,616,067 | 956,189,515 | 10.90% | 5.30% |
| 2 | Korea | 572,708,493 | 944,236,844 | 9.60% | 14% |
| 3 | America | 467,128,215 | 809,406,725 | 35.80% | 36.40% |
| 4 | Australia | 281,007,600 | 430,345,613 | -1.30% | -8.50% |
| 5 | Hong Kong | 247,537,781 | 416,969,089 | 9.20% | 12.40% |
| 6 | Bahamas | 36,139,944 | 340,832,596 | 1376.60% | 1991% |
| 7 | Indonesia | 247,426,641 | 330,801,287 | 27.10% | 2.10% |
| 8 | Vietnam | 201,698,421 | 319,127,138 | 9.80% | -0.40% |
| 9 | Macau | 110,054,402 | 252,796,654 | 17.30% | 71.30% |
| 10 | Singapore | 126,053,728 | 250,017,858 | -7.20% | -3.40% |

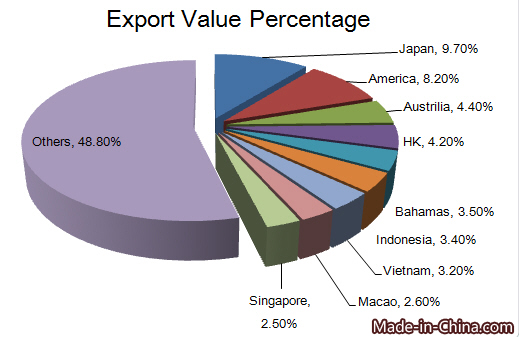
From January to October in 2015, Japan, Korea, America, Australia, Hong Kong, Bahamas, Indonesia, Vietnam Macau and Singapore were major countries for China’s iron & steel structures (rods, angle, plate) export. Japan was the largest export markets for China during this period. The value of iron & steel structures (rods, angle, plates) China exported to Japan accounted for 9.7% of the total.
Distribution Countries/Regions in Need of Iron & Steel Structures (Rods, Angle, Plates)
| Importing Country/Region | Import Value | ||
| 2012 | 2013 | 2014 | |
| Germany | 2,991,261,000 | 3,080,415,000 | 3,191,700,000 |
| America | 3,393,778,000 | 2,614,446,000 | 2,902,427,000 |
| Korea | 2,034,688,000 | 1,879,267,000 | 2,205,288,000 |
| France | 1,666,359,000 | 1,646,636,000 | 1,707,200,000 |
| Australia | 1,720,608,000 | 2,322,598,000 | 1,695,597,000 |
Unit: USD
Major iron & steel structures (rods, angle, plates) importing countries were Germany, America, Korea, France and Australia in 2014. As the largest importing country, Germany’s import value was USD 3192 million in 2014.
Major Iron & Steel Structures (Rods, Angle, Plates) Exporting Counties
| Exporting Country/Region | Export Value | ||
| 2012 | 2013 | 2014 | |
| China | 10,861,494,000 | 10,959,918,000 | 11,324,341,000 |
| Germany | 4,397,388,000 | 5,202,496,000 | 5,387,228,000 |
| Korea | 2,812,877,000 | 2,408,042,000 | 2,817,291,000 |
| Poland | 1,923,510,000 | 2,117,261,000 | 2,228,248,000 |
| Italy | 1,641,725,000 | 2,097,644,000 | 2,106,596,000 |
Unit: USD
Main iron & steel structures (rods, angle, plates) exporting countries included China, Germany, Korea, Poland and Italy. As the largest exporting country, China’s iron & steel structures export value was USD 11324 million in 2014.


