Distribution of China's Electric Generating Sets and Rotary Converters Export Enterprises
| Provinces | Export Value | Percentage |
| Jiangsu | 979,599,475 | 25.61% |
| Zhejiang | 569,204,270 | 14.88% |
| Fujian | 469,914,979 | 12.29% |
| Chongqing | 427,412,584 | 11.18% |
| Tianjin | 354,175,261 | 9.26% |
From January to December in 2015, Jiangsu, Zhejiang and Fujian were China's main provinces where electric generating sets and rotary converters export enterprises located. The export of Jiangsu accounted for 25.61% of China's total.
Major Countries for China's Electric Generating Sets and Rotary Converters Export
| No. | Country | Volume(Units) | Value(USD) | Y-o-Y | |
| Volume | Value | ||||
| 1 | The United States | 1,188,058 | 382,158,188 | -6.20% | -2.60% |
| 2 | Indonesia | 381,720 | 242,637,816 | -27.30% | -32.10% |
| 3 | Pakistan | 226,489 | 213,149,849 | 15.10% | 138.20% |
| 4 | United Arab Emirates | 511,895 | 210,183,811 | -36.20% | -7.40% |
| 5 | Nigeria | 1,132,958 | 174,020,364 | -45.40% | -43% |
| 6 | Turkey | 144,734 | 135,676,638 | 16.30% | -6.70% |
| 7 | South Africa | 289,177 | 126,854,159 | 114.40% | 42.50% |
| 8 | Philippines | 103,997 | 115,467,468 | -40.50% | -7.30% |
| 9 | Saudi Arabia | 49,387 | 102,575,115 | 5.70% | 4.40% |
| 10 | Thailand | 45,140 | 96,178,365 | 20.50% | 129% |
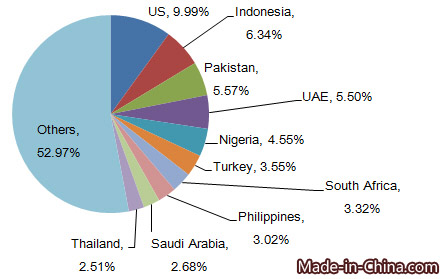
From January to December in 2015, major markets for China's electric generating sets and rotary converters export included Thailand, Indonesia, Pakistan, United Arab Emirates, Nigeria, Turkey and South Africa. The United States, Indonesia and Pakistan were the top 3 export markets for China's electric generating sets and rotary converters. China's exports to Pakistan grew the fastest, up 138.2%.
Major Electric Generating Sets and Rotary Converters Demanded Countries
| Import Countries | Import Value(USD) | Y-o-Y |
| Russian Federation | 1,342,765 | -48.93% |
| The United States | 1,309,335 | 21.95% |
| Mexico | 1,103,525 | 1.55% |
| China | 1,074,497 | -31.70% |
| Canada | 962,545 | -29.82% |
From January to December in 2015, Russia was the largest electric generating sets and rotary converters demanded country and the import value was USD 1,343,000,000. China ranked as the fourth and import value was USD 1,074,000,000.
Major Electric Generating Sets and Rotary Converters Export Countries
| Country | Import Value(USD) | Y-o-Y |
| China | 3,825,596,000 | -11.30% |
| Germany | 3,288,756,000 | 3.94% |
| Denmark | 3,174,750,000 | -16.67% |
| The United States | 2,760,684,000 | -25.73% |
| Spain | 1,891,121,000 | -6.04% |
From January to December in 2015, China's top the list of electric generating sets and rotary converters export country and export value was USD 3,826,000,000. Germany ranked as the second and the export value was USD 3,288,000,000.


