Distribution of China Sheet Piling Export Enterprise
| No. | Region | Export Value | Y-o-Y | ||
| Volume(kg) | Value(USD) | Volume | Value | ||
| 1 | Liaoning | 171,565,017 | 88,509,559 | 19.90% | -1.80% |
| 2 | Jiangsu | 57,246,934 | 39,803,044 | 23.50% | 4.90% |
| 3 | Shanghai | 28,822,974 | 19,638,368 | 92.60% | 58.60% |
| 4 | Hebei | 31,714,472 | 18,781,351 | 4.20% | -35.10% |
| 5 | Zhejiang | 8,670,456 | 9,299,612 | 92.60% | 26.70% |
| 6 | Shandong | 5,783,279 | 7,126,419 | 64.40% | 50.40% |
| 7 | Guangdong | 3,688,347 | 6,440,211 | -73.10% | -58.30% |
| 8 | Tianjin | 5,303,784 | 4,695,788 | 15.90% | 4.90% |
| 9 | Fujian | 3,085,343 | 2,805,570 | 61.10% | 34.90% |
| 10 | Beijing | 1,312,978 | 1,279,704 | 4.70% | -25.30% |
From January to October, Liaoning, Jiangsu, Shanghai were major regions where China’s sheet piling export enterprises located, among of which, Liaoning province’s export value accounted for 44.1% of China’s total sheet piling export.
Distributions of Major Countries/Regions for China’s Sheet Piling Export
| No. | Country/Region | Export Value | Y-o-Y | ||
| Volume(kg) | Value(USD) | Volume | Value | ||
| 1 | Philippines | 67,425,992 | 34,885,980 | 170.40% | 124.20% |
| 2 | Hong Kong | 66,460,273 | 32,597,684 | -27.20% | -46.10% |
| 3 | Vietnam | 24,088,340 | 13,726,919 | 97.90% | 74.10% |
| 4 | Australia | 13,114,528 | 11,861,714 | 9.70% | -3.20% |
| 5 | Indonesia | 17,163,770 | 9,801,648 | 189.90% | 123.50% |
| 6 | Singapore | 18,296,732 | 9,710,527 | 25% | -11.70% |
| 7 | India | 13,241,070 | 9,051,571 | 295.20% | 180.90% |
| 8 | Japan | 4,026,314 | 7,731,677 | 10.40% | 1.90% |
| 9 | Korea | 11,023,442 | 7,055,510 | -33.30% | -41.50% |
| 10 | America | 6,971,844 | 6,202,297 | 269.70% | 124.40% |
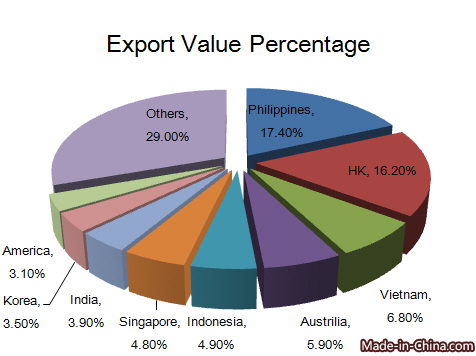
From Jan. to Oct. in 2015, Philippines, Hong Kong, Vietnam, Australia, Indonesia, Singapore, India, Japan, Korea and America were major countries for China’s sheet piling export, among of which, Philippines topped the list of the export value, followed by Hong Kong. Philippines’s export value accounted for 17.4% of China’s total sheet piling export while Hong Kong’s accounted for 16.2%. Among the top 10 export markets for sheet piling, the value of sheet piling China exported to Philippines, Hong Kong, Indonesia, India and America increased rapidly.
Major Countries/Regions in Need of Sheet Piling
| Importing Country/Region | Import Value | ||
| 2012 | 2013 | 2014 | |
| Netherlands | 189,667,000 | 207,989,000 | 216,689,000 |
| America | 128,799,000 | 173,245,000 | 174,522,000 |
| England | 88,975,000 | 100,204,000 | 144,113,000 |
| Germany | 85,583,000 | 125,289,000 | 126,365,000 |
| UAE | 57,198,000 | 18,814,000 | 126,308,000 |
Unit: USD Thousand
Major sheet piling importing countries from 2012 to 2014 were Netherlands, America, England, Germany and The United Arab Emirates. As the largest importing country, Netherland’s import value was USD 217 million.
Major Sheet Piling Exporting Countries
| Exporting Country/Region | Export Value | ||
| 2012 | 2013 | 2014 | |
| Luxembourg | 600,480,000 | 597,647,000 | 564,218,000 |
| China | 196,668,000 | 248,585,000 | 247,091,000 |
| Germany | 157,867,000 | 214,259,000 | 224,589,000 |
| America | 150,039,000 | 156,954,000 | 133,517,000 |
| Poland | 72,851,000 | 102,989,000 | 129,495,000 |
Unit: USD
Main sheet piling exporting countries included Luxembourg, China, Germany, America and Poland. Luxembourg was the largest export country in 2014 with the export value of USD 564 million, followed by China with the export value of USD 247 million in 2014.


