Annual Trend of China's Impregnated, Coated or Laminated Textile Fabric Export Value from 2012 to 2015
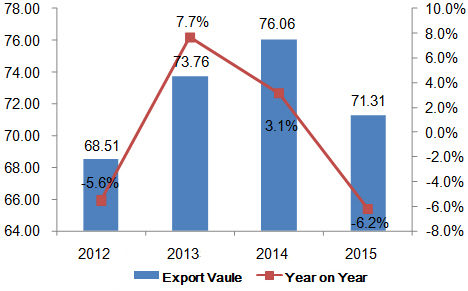
From 2012 to 2015, China's impregnated, coated or laminated textile fabric export value trended down. The export value in 2015 was USD 7,131,000,000, falling 4.1% from 2012.
Monthly Trend of China's Impregnated, Coated or Laminated Textile Fabric Export Value from 2012 to 2015

China's impregnated, coated or laminated textile fabric export value surged in the second quarter during the period from 2012 to 2015. In 2015, the export value peaked in May and hit a trough in March.
China's Impregnated, Coated or Laminated Textile Fabric Export Volume & Value in 2015
| Month | Volume(kg) | Value(USD) | on Year | |
| Volume | Value | |||
| January | 177,677,706 | 651,210,754 | -7.90% | -7.60% |
| February | 154,711,830 | 558,882,572 | 107.40% | 93.50% |
| March | 109,118,841 | 397,131,985 | -32.10% | -34% |
| April | 174,934,619 | 642,399,877 | -9.10% | -11% |
| May | 186,351,553 | 664,538,847 | -2.50% | -6.50% |
| June | 178,005,366 | 633,851,703 | 2% | -1.10% |
| July | 172,086,757 | 611,030,252 | -6.40% | -10.40% |
| August | 169,511,128 | 601,663,089 | -10% | -14.10% |
| September | 167,941,512 | 611,299,288 | -3.70% | -4.40% |
| October | 168,512,163 | 582,034,122 | -3.20% | -9.50% |
| November | 162,524,737 | 554,148,157 | -3.40% | -10.70% |
| December | 181,768,954 | 622,578,352 | 5.90% | -4.60% |
| Total | 2,003,145,166 | 7,130,768,998 | -2.10% | -6.30% |
China's impregnated, coated or laminated textile fabric export value reached USD 7,131,000,000 in 2015, falling 6.3% on year.
| No. | Country/Region | Volume(kg) | Value(USD) | on Year | |
| Volume | Value | ||||
| 1 | India | 258,066,804 | 683,826,509 | -6.40% | -12.10% |
| 2 | Vietnam | 135,880,430 | 660,599,583 | 12.70% | 5.10% |
| 3 | United States | 123,141,565 | 534,959,875 | 3.50% | 3.30% |
| 4 | Hong Kong | 35,423,374 | 366,528,041 | -26.20% | -22.50% |
| 5 | Indonesia | 142,679,213 | 359,812,865 | 0.10% | -8.30% |
| 6 | Thailand | 91,357,545 | 280,499,639 | 9.60% | 6.40% |
| 7 | Mexico | 101,289,478 | 249,976,057 | 16.80% | 4.20% |
| 8 | Russia | 66,089,282 | 220,307,028 | -13.30% | -13% |
| 9 | Turkey | 57,724,335 | 186,195,211 | -14% | -15.40% |
| 10 | Japan | 39,474,435 | 183,774,462 | -4.90% | -9.70% |
| 11 | Bangladesh | 34,403,948 | 179,255,899 | 6.80% | 4.90% |
| 12 | Korea | 30,010,316 | 167,579,896 | 2.60% | -2.10% |
| 13 | Brazil | 49,321,957 | 157,652,744 | -29.80% | -23.80% |
| 14 | Philippines | 55,422,356 | 144,553,834 | 4% | -3.30% |
| 15 | Pakistan | 41,388,662 | 138,399,419 | 20.10% | 3.70% |
| 16 | Malaysia | 36,557,948 | 134,066,054 | -21.50% | -17.30% |
| 17 | Germany | 27,058,219 | 124,813,271 | -8.90% | -14.30% |
| 18 | Iran | 40,671,671 | 113,738,972 | -11.80% | -16.30% |
| 19 | Poland | 31,846,772 | 108,921,028 | 5.30% | -0.80% |
| 20 | Italy | 20,741,077 | 102,445,036 | -0.40% | -5.90% |
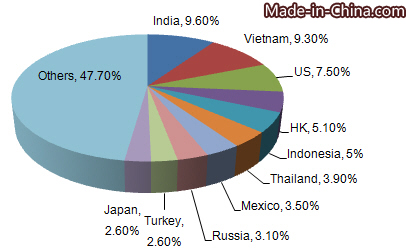
Major markets for China's impregnated, coated or laminated textile fabric export included India, Vietnam, Russia, etc in 2015. India and Vietnam were major markets for China's impregnated, coated or laminated textile fabric export. China's impregnated, coated or laminated textile fabric exports to India declined in 2015 on year and it accounted for 9.6% of China's total impregnated, coated or laminated textile fabric export. From January to December in 2015, China's impregnated, coated or laminated textile fabric exports to Thailand grew 6.4% on year.
China's Impregnated, Coated or Laminated Textile Fabric Export Origins in 2015
| No. | Districts | Volume(kg) | Value(USD) | on Year | |
| Volume | Value | ||||
| 1 | Zhejiang | 877,702,373 | 2,517,203,946 | -2.40% | -8.50% |
| 2 | Jiangsu | 459,499,126 | 1,779,111,015 | -1.60% | -4.90% |
| 3 | Guangdong | 261,037,230 | 1,049,862,647 | -7% | -4.90% |
| 4 | Fujian | 120,488,338 | 588,048,407 | 17.80% | 3.80% |
| 5 | Shanghai | 117,146,350 | 446,575,396 | -8.70% | -12.90% |
| 6 | Shandong | 40,984,898 | 196,711,990 | 19.80% | 10.30% |
| 7 | Anhui | 32,379,270 | 166,376,086 | -7.10% | -12.10% |
| 8 | Hebei | 45,317,438 | 123,031,350 | -3.30% | -14% |
| 9 | Henan | 20,865,520 | 87,339,527 | -12.30% | -11.70% |
| 10 | Liaoning | 7,694,766 | 56,698,564 | 8.20% | 1.70% |
| 11 | Tianjin | 2,237,187 | 18,596,942 | 1.60% | 1.90% |
| 12 | Jiangxi | 1,344,804 | 18,081,265 | 29.60% | 72.90% |
| 13 | Beijing | 1,441,190 | 15,054,321 | -22.20% | -16.90% |
| 14 | Xinjiang | 2,772,029 | 13,917,992 | -63.60% | -66.70% |
| 15 | Jiangxi | 2,323,110 | 13,410,952 | 87.70% | 88.10% |
| 16 | Hubei | 1,947,798 | 8,420,597 | -17.20% | -19.70% |
| 17 | Jilin | 2,422,217 | 6,585,963 | 13.10% | -2.20% |
| 18 | Sichuan | 1,018,617 | 5,343,044 | 27% | -12.60% |
| 19 | Hunan | 696,311 | 4,345,012 | 57.50% | 66% |
| 20 | Yunnan | 1,248,941 | 3,988,076 | 48.80% | 45.90% |
Zhejiang, Shandong and Jiangsu were China's major impregnated, coated or laminated textile fabric export origins. In 2015, their impregnated, coated or laminated textile fabric export value accounted for 79.8% of China's total. In China's top 20 export origins, Jiangxi's impregnated, coated or laminated textile fabric export value grew 88.1% on year.


