Annual Export Trends of China's Footwear & Gaiters
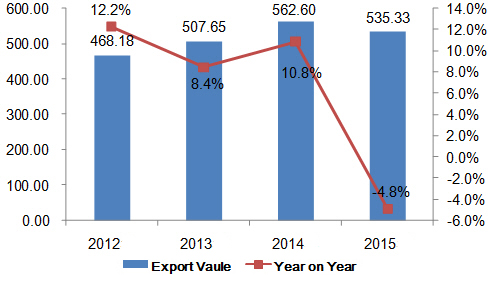
China's footwear& gaiters export has trended up since 2013 during the period from 2012 to 2015. The export value in 2015 was USD 53,533,000,000, growing 14.3% on year.
Monthly Export Trends of China's Footwear & Gaiters
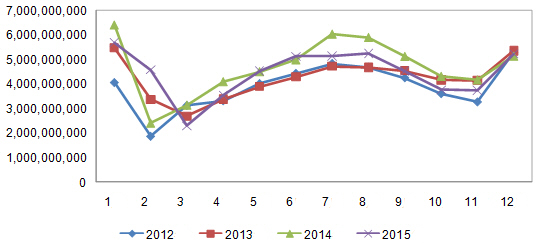
According to the chart above, from 2012 to 2015, China's footwear& gaiters exports surged in January. In 2015, exports peak was in January and trough was in March
China's Footwear & Gaiters Export Volume & Value in 2015
| Month | Volume(kg) | Value(USD) | on Year | |
| Volume | Value | |||
| January | 470,121,212 | 5,696,638,001 | -13.60% | -10.90% |
| February | 386,503,816 | 4,593,965,864 | 90.30% | 89.90% |
| March | 193,332,044 | 2,309,098,900 | -33.80% | -26.80% |
| April | 319,899,881 | 3,564,420,905 | -18.70% | -13.20% |
| May | 393,836,278 | 4,536,378,410 | -5.90% | 0.70% |
| June | 424,057,390 | 5,139,463,856 | -4.40% | 3.10% |
| July | 426,262,702 | 5,146,709,077 | -17.50% | -14.70% |
| August | 445,078,416 | 5,250,842,222 | -9.90% | -10.90% |
| September | 377,984,862 | 4,539,179,204 | -11.50% | -11.50% |
| October | 320,138,716 | 3,771,639,876 | -15.90% | -12.70% |
| November | 296,575,459 | 3,751,682,682 | -16.70% | -10.10% |
| December | 419,214,498 | 5,232,688,084 | 1% | 1.90% |
| Total | 4,473,005,274 | 53,532,707,081 | -8.40% | -4.80% |
From January to December in 2015, China's footwear& gaiters export value reached USD 53,532,707,081, falling 4.8% on year.
Export Destinations for China's Footwear & Gaiters in 2015
| No. | Country/Region | Volume(kg) | Value(USD) | on Year | |
| Volume | Value | ||||
| 1 | United States | 965,649,521 | 14,048,502,379 | 1.10% | 1.50% |
| 2 | United Kingdom | 259,175,120 | 2,828,878,986 | 10.90% | 13.30% |
| 3 | Japan | 214,778,361 | 2,495,060,496 | -8.70% | -8.10% |
| 4 | Germany | 163,055,304 | 2,015,758,947 | -16.90% | -14.10% |
| 5 | Russia | 120,221,034 | 1,846,675,225 | -37.10% | -40.40% |
| 6 | Hong Kong | 123,514,589 | 1,585,833,825 | -2.60% | -12.20% |
| 7 | United Arab Emirates | 120,571,326 | 1,393,600,658 | 4.30% | 16.20% |
| 8 | Korea | 82,312,272 | 1,363,433,829 | -6.60% | 7% |
| 9 | Kazakhstan | 87,785,547 | 1,348,672,688 | -42% | -39.60% |
| 10 | Malaysia | 98,877,139 | 1,217,611,959 | -14.30% | -1.60% |
| 11 | Netherland | 78,964,563 | 1,032,192,315 | -22.10% | -18.90% |
| 12 | Belgium | 72,198,116 | 981,323,550 | -4.50% | 0.40% |
| 13 | Vietnam | 67,967,140 | 945,028,929 | 34.60% | 39.20% |
| 14 | Spain | 82,985,312 | 938,268,196 | -9.20% | -6.30% |
| 15 | Canada | 63,204,136 | 880,834,972 | -5.70% | -1% |
| 16 | Philippines | 87,349,260 | 859,380,807 | 28.90% | 46.20% |
| 17 | France | 68,782,605 | 819,377,922 | -16.30% | -15.10% |
| 18 | Italy | 62,908,560 | 807,720,867 | -2.90% | -3.30% |
| 19 | Australia | 54,242,684 | 762,973,167 | 2.40% | 7.80% |
| 20 | South Africa | 79,677,340 | 717,904,599 | -10.10% | -6.30% |
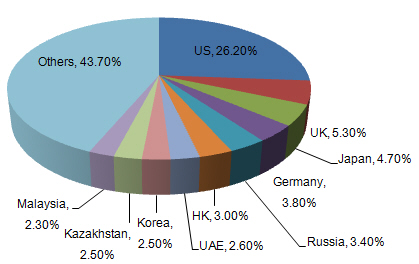
From January to December in 2015, the top export destinations of China's footwear& gaiters were the United States, the United Kingdom, Japan and Germany. In 2015, China exports to Philippines grew faster than exports to other markets and the growth was 46.2% on year.
Export Origins of China's Footwear & Gaiters
| No. | District | Volume(kg) | Value(USD) | on Year | |
| Volume | Value | ||||
| 1 | Guangdong | 1,428,479,440 | 19,184,366,543 | -6.40% | -1.30% |
| 2 | Zhejiang | 1,185,142,206 | 10,603,368,218 | -7.70% | -3.20% |
| 3 | Fujian | 845,579,096 | 10,062,997,127 | -10.90% | -7.80% |
| 4 | Xinjiang | 170,923,902 | 2,367,538,896 | -29.40% | -25.70% |
| 5 | Jiangsu | 215,482,972 | 2,230,490,255 | -5.10% | -3.30% |
| 6 | Jiangxi | 146,376,192 | 2,015,594,214 | 17.20% | 23% |
| 7 | Shandong | 114,391,042 | 1,399,597,766 | 1.70% | 5.30% |
| 8 | Sichuan | 39,312,249 | 743,939,221 | -30.90% | -36.40% |
| 9 | Hunan | 33,359,654 | 656,348,910 | 17.90% | 20.70% |
| 10 | Shanghai | 50,623,882 | 608,993,595 | -11.90% | -14.80% |
| 11 | Henan | 30,886,750 | 450,947,487 | -6.30% | -4.80% |
| 12 | Heilongjiang | 24,473,568 | 412,811,538 | -46.80% | -56.60% |
| 13 | Anhui | 35,801,652 | 408,291,557 | 8.50% | 29.40% |
| 14 | Hubei | 21,646,622 | 402,143,347 | 11.50% | 17.80% |
| 15 | Chongqing | 17,176,925 | 334,772,188 | 17.50% | 62.80% |
| 16 | Hebei | 24,911,817 | 331,443,013 | 13.60% | 16.10% |
| 17 | Liaoning | 20,094,876 | 317,865,788 | -19.80% | -15.40% |
| 18 | Tianjin | 23,339,117 | 285,877,792 | -20.70% | -16.90% |
| 19 | Guangxi | 10,991,411 | 232,221,617 | 27.20% | 31.80% |
| 20 | Guizhou | 4,140,809 | 80,212,045 | -7.60% | 26.90% |
The top export origins of China's footwear& gaiters were Guangdong, Zhejiang and Fujian province in 2015. Guangdong provinces exported USD 19,184,366,543, making the largest export origins in China. The average export price for footwear& gaiters from Guangxi was the highest (USD 21.13per).


