China Copper and Articles Export Volume & Value in 2015
| Month | Volume(kg) | Value(USD) | on Year | |
| Volume | Value | |||
| January | 80,799,844 | 638,515,379 | 10.30% | 4.20% |
| February | 55,741,552 | 459,819,458 | 16.60% | 16.80% |
| March | 59,886,153 | 431,635,574 | -6.20% | -20% |
| April | 72,911,672 | 542,228,889 | -5.90% | -15.60% |
| May | 71,300,217 | 541,177,863 | -16.30% | -23% |
| June | 56,748,552 | 440,704,188 | -36.50% | -37.80% |
| July | 58,600,911 | 449,962,573 | -27% | -31.80% |
| August | 59,071,155 | 446,759,264 | -13% | -21.40% |
| September | 55,434,118 | 419,982,306 | -5.60% | -16.10% |
| October | 49,236,787 | 364,021,674 | -17.50% | -27.20% |
| November | 58,024,628 | 410,079,338 | -13.30% | -26% |
| December | 69,480,482 | 478,670,249 | -7.20% | -20.40% |
| Total | 747,236,071 | 5,623,556,755 | -11.60% | -19.50% |
China’s copper and articles export value reached USD 5,624,000,000 in 2015, falling 19.5% on year.
Destinations for China’s Copper and Articles
| No. | Country/Region | Volume(kg) | Value(USD) | on Year | |
| Volume | Value | ||||
| 1 | Taiwan | 105,742,334 | 659,639,045 | -13.30% | -27.10% |
| 2 | Hong Kong | 79,533,160 | 544,920,338 | -22.50% | -33.30% |
| 3 | Korea | 74,411,183 | 462,945,715 | -42% | -47.50% |
| 4 | Malaysia | 68,871,325 | 443,421,848 | 32.50% | 10.70% |
| 5 | United States | 36,878,201 | 414,446,286 | -24.10% | -22.10% |
| 6 | Thailand | 58,453,735 | 392,495,835 | 20.10% | 5.90% |
| 7 | Japan | 30,749,252 | 296,707,711 | -13.30% | -21.50% |
| 8 | Vietnam | 33,996,479 | 234,965,014 | 3.80% | -6.20% |
| 9 | India | 25,129,275 | 153,743,466 | -15.20% | -22.20% |
| 10 | Australia | 12,834,697 | 137,197,468 | 8.60% | 3.90% |

Taiwan was top destination for China’s copper and articles products in 2015. Korea ranked as the third and the export from China to Korea in 2015 was USD 462,945,715. China’s copper and articles export to Malaysia grew fast and the growth was 10.7% on 2014.
Export Origins of China's Export Copper and Articles
| No. | District | Volume(kg) | Value(USD) | on Year | |
| Volume | Value | ||||
| 1 | Zhejiang | 182,478,658 | 1,570,087,260 | 2.30% | -5.80% |
| 2 | Guangdong | 131,466,090 | 1,037,150,883 | -15.60% | -23.30% |
| 3 | Shanghai | 90,485,527 | 643,637,517 | -23.50% | -30.40% |
| 4 | Jiangsu | 79,675,380 | 627,117,483 | -5.60% | -12.10% |
| 5 | Shandong | 93,645,568 | 568,968,717 | -14.10% | -27.50% |
| 6 | Jiangxi | 46,057,624 | 283,857,413 | 40.40% | 18.70% |
| 7 | Anhui | 44,192,455 | 254,947,008 | -36.20% | -47.50% |
| 8 | Henan | 21,902,724 | 157,922,974 | -35.90% | -43.30% |
| 9 | Fujian | 5,695,876 | 61,002,232 | -8.60% | -5.40% |
| 10 | Chongqing | 7,282,434 | 59,999,782 | 40.40% | 44.90% |
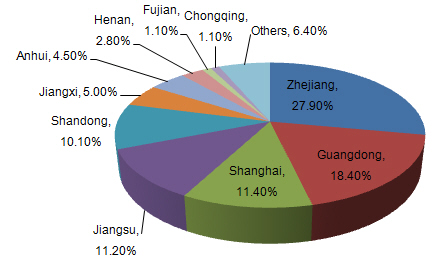
Zhejiang province exported USD 1,570,087,260 copper and articles in 2015, making the largest origin. Other export origins included Guangdong province, Jiangsu province, Shanghai city, etc. Fujian’s average export price was USD 10.71 per kg, ranking first in the top ten origins.


