China Percussion Musical Instruments Export Volume & Value
| Month | Volume | Value(USD) | Y-o-Y | |
| Volume | Value | |||
| Jan. | 670,316 | 12,048,413 | -58% | -9.10% |
| Feb. | 834,719 | 11,217,578 | 28.40% | 71.60% |
| Mar. | 454,706 | 7,065,838 | -63.80% | -34.10% |
| Apr. | 684,337 | 10,381,469 | -63.20% | -17.30% |
| May | 633,746 | 10,664,176 | -30.30% | -19.60% |
| Jun. | 784,132 | 12,357,956 | 0.70% | 20.40% |
| Total | 4,061,956 | 63,735,430 | -42.50% | -4.30% |
From January to June in 2015, China percussion musical instruments export value reached USD 63.7 million, down 4.3% by year, while the export volume reached 4.062 million, down 42.5% by year.
Major Regions for China’s Percussion Musical Instruments Export
| No. | Country/Region | Volume | Value(USD) | Y-o-Y | |
| Volume | Value | ||||
| 1 | America | 1,147,144 | 18,460,912 | 24% | 16.60% |
| 2 | Germany | 298,903 | 4,231,932 | -89.70% | -52.90% |
| 3 | Nigeria | 53,806 | 3,276,632 | -34.70% | -30.10% |
| 4 | Korea | 435,567 | 2,728,859 | 14.90% | 2.10% |
| 5 | Japan | 188,951 | 2,393,552 | -38% | -15.40% |
| 6 | Brazil | 64,412 | 2,093,540 | -55.80% | -24.20% |
| 7 | Netherlands | 48,536 | 1,769,332 | -57% | -30.40% |
| 8 | England | 156,386 | 1,647,599 | 31.90% | 3.90% |
| 9 | Mexico | 76,768 | 1,425,713 | 83.20% | -11% |
| 10 | Indonesia | 33,969 | 1,420,284 | 38.60% | 19.10% |
| 11 | Philippines | 66,397 | 1,380,324 | -23.80% | -12.10% |
| 12 | Australia | 96,696 | 1,250,258 | -7.60% | 12.50% |
| 13 | Chile | 89,887 | 1,217,762 | 11.50% | 14.30% |
| 14 | Canada | 66,992 | 1,206,430 | 1.50% | -16.90% |
| 15 | Thailand | 27,112 | 1,148,162 | -21.60% | 20.10% |
| 16 | Malaysia | 68,110 | 1,016,102 | 108.50% | 142.20% |
| 17 | Italy | 74,492 | 1,000,368 | 7.20% | -13.40% |
| 18 | France | 41,986 | 953,940 | 4.90% | -1.20% |
| 19 | Ghana | 57,902 | 935,112 | -36.10% | -15.60% |
| 20 | Guatemala | 40,656 | 815,909 | -3.50% | 6.30% |
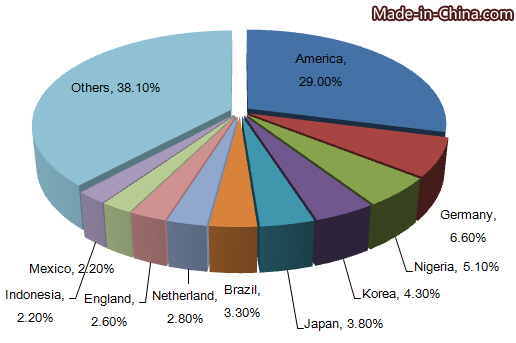
From January to June in 2015, the export data shows that America, Germany, Nigeria, Korea, Japan, Brazil, Netherlands, England, Mexico and Indonesia topped the country list for China’s percussion musical instruments export. America is the largest export market for China’s percussion musical instruments, followed by Germany and Nigeria. The export value to these three countries accounted for 29%, 6.6%, and 5.1% of China’s percussion musical instruments total export value respectively.
From January to June in 2015, in the top 20 export markets, the export value to Malaysia grew fastest, 142.2% higher than that in 2014.
Distribution of China’s Percussion Musical Instruments Origins
| No. | Region | Volume | Value(USD) | Y-O-Y | |
| Volume | Value | ||||
| 1 | Tianjin | 1,127,487 | 28,666,391 | 2.10% | 4.20% |
| 2 | Guangdong | 514,809 | 11,256,500 | -22.80% | 23.80% |
| 3 | Hebei | 799,547 | 6,198,876 | 0% | -8.90% |
| 4 | Zhejiang | 1,022,766 | 5,456,353 | -73.10% | -51.90% |
| 5 | Shanghai | 45,419 | 3,774,966 | -67.10% | -5.70% |
| 6 | Hubei | 52,221 | 1,950,706 | 25.80% | 32.60% |
| 7 | Jiangsu | 196,628 | 1,822,132 | 21.60% | -28.70% |
| 8 | Shandong | 108,261 | 1,145,969 | 208.80% | 104.60% |
| 9 | Fujian | 25,542 | 1,032,389 | -8.50% | -9.30% |
| 10 | Jiangxi | 70,287 | 779,462 | 54.10% | 83.60% |
Tianjin, Guangdong and Hebei are the major origins for China’s percussion musical instruments export. From January to June in 2015, the above three provinces’ total export volume accounted for 60.1% of China’s percussion musical instruments total export, while the total export value accounted for 72.4% of the total.
From January to June in 2015, in the top 10 supply source, Shandong’s export value grew fastest, up 104.6% by year.


