China Lead and Articles Export Volume & Value in 2015
| Month | Volume(kg) | Value(USD) | on Year | |
| Volume | Value | |||
| January | 6,629,584 | 14,474,392 | 49.10% | 31.40% |
| February | 4,917,840 | 11,941,571 | -11.70% | -6.80% |
| March | 7,481,339 | 15,112,022 | 51.40% | 30% |
| April | 8,292,521 | 17,281,345 | 26.80% | 18% |
| May | 6,808,154 | 14,711,610 | 25.80% | 12.80% |
| June | 7,165,254 | 14,560,899 | 31.40% | 8.50% |
| July | 5,841,912 | 12,022,381 | -16% | -23.30% |
| August | 6,142,019 | 13,266,672 | 19.50% | 10.10% |
| September | 6,955,003 | 13,665,383 | 25.70% | 4.50% |
| October | 4,175,715 | 8,730,429 | 14.90% | -0.70% |
| November | 4,799,780 | 10,035,471 | -32.30% | -37.60% |
| December | 7,226,653 | 14,191,927 | -10.40% | -22.30% |
| Total | 76,435,774 | 159,994,102 | 11.10% | -0.30% |
China's lead and articles export value reached USD 160,000,000 in 2015, falling 0.3% on year.
Destinations for China's Lead and Articles
| No. | Country/Region | Volume(kg) | Value(USD) | on Year | |
| Volume | Value | ||||
| 1 | Vietnam | 25,796,514 | 51,445,648 | 14.50% | 3.20% |
| 2 | Taiwan | 15,963,808 | 30,836,011 | -5.80% | -15.60% |
| 3 | Indonesia | 10,005,884 | 21,362,474 | 10.70% | 4.30% |
| 4 | Thailand | 9,374,774 | 18,119,815 | 72.90% | 43.80% |
| 5 | Hong Kong | 3,724,178 | 7,376,422 | 1523.80% | 480.90% |
| 6 | Malaysia | 2,585,830 | 5,430,660 | -17.60% | -25.20% |
| 7 | Japan | 1,615,618 | 4,769,665 | -18.80% | -20% |
| 8 | Bangladesh | 1,207,253 | 3,332,111 | 74.20% | 53.20% |
| 9 | South Africa | 1,318,242 | 2,537,211 | -0.70% | -17.40% |
| 10 | United States | 383,506 | 2,434,854 | 14.40% | 2.20% |
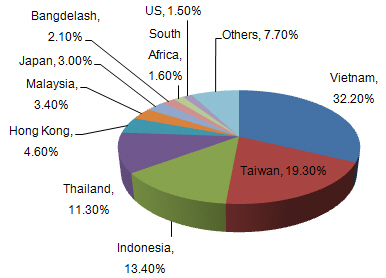
Vietnam was top destination for China's lead and articles products in 2015.Indonesia ranked as the third and the export from China to Indonesia in 2015 was USD 21,362,474. China's lead and articles export to Hong Kong grew fast and the growth was 480.9% on 2014.
Export Origins of China' Export Lead and Articles
| No. | District | Volume(kg) | Value(USD) | on Year | |
| Volume | Value | ||||
| 1 | Hunan | 54,112,350 | 106,199,914 | 47.60% | 36.50% |
| 2 | Henan | 10,404,228 | 19,861,056 | -35.30% | -47% |
| 3 | Shanghai | 3,759,647 | 9,894,320 | -60.50% | -57.30% |
| 4 | Shandong | 1,977,002 | 5,340,840 | 56.50% | 40.30% |
| 5 | Guangdong | 1,725,042 | 4,785,249 | 22.20% | -12.30% |
| 6 | Yunnan | 863,971 | 3,372,633 | 48.60% | 55.40% |
| 7 | Zhejiang | 921,998 | 3,075,826 | 13.10% | 9% |
| 8 | Jiangsu | 665,336 | 2,537,979 | 15.10% | 6.10% |
| 9 | Jiangxi | 303,189 | 833,678 | 770.10% | 788.40% |
| 10 | Heilongjiang | 169,170 | 730,262 | 2042.70% | 1082.90% |
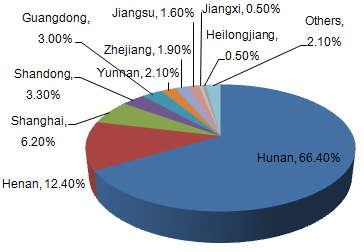
Hunan province exported USD 106,199,914 lead and articles in 2015, making the largest origin. Other export origins included Guangdong province, Jiangsu province, Henan province, etc. The growth of Heilongjiang's lead and articles export ranked first in the top ten origins.


