Annual Export Trends of China's Taps, Cocks, Valves for Pipes & Tanks from 2012 to 2015
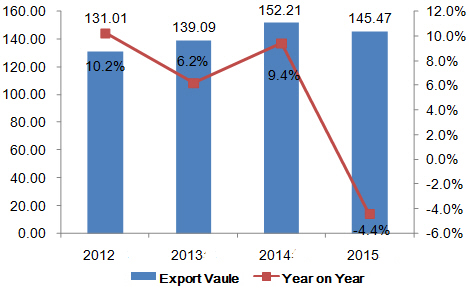
China's taps, cocks, valves for pipes & tanks export has trended up during the period from 2012 to 2015. The export value in 2015 was USD 14,547,000,000, growing 11% on 2012.
Monthly Export Trends of China's Taps, Cocks, Valves for Pipes & Tanks from 2012 to 2015
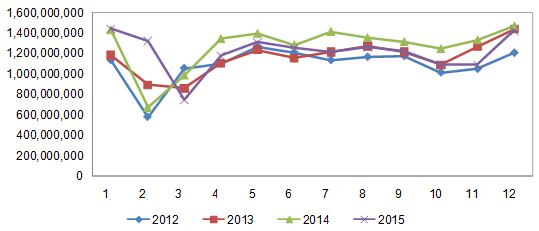
In 2015, China's taps, cocks, valves for pipes & tanks exports peak was in January and trough was in March.
China's Taps, Cocks, Valves for Pipes & Tanks Export Volume & Value in 2015
| Month | Volume | Value(USD) | on Year | |
| Volume | Value | |||
| January | 435,068,127 | 1,441,363,352 | 0.70% | 0.90% |
| February | 403,440,248 | 1,322,473,293 | 96.60% | 97.10% |
| March | 247,748,718 | 745,677,706 | -24.40% | -24.30% |
| April | 384,837,435 | 1,175,740,629 | -6.10% | -12.30% |
| May | 429,339,111 | 1,310,657,454 | 0.60% | -6% |
| June | 403,253,112 | 1,251,716,133 | 1.50% | -2.20% |
| July | 384,959,899 | 1,212,797,752 | -10.90% | -14.10% |
| August | 362,517,847 | 1,263,515,687 | -11.40% | -6.50% |
| September | 393,445,856 | 1,221,503,362 | 1.50% | -7% |
| October | 343,809,816 | 1,089,943,495 | -6.70% | -12.40% |
| November | 341,601,619 | 1,090,881,364 | -13.30% | -18% |
| December | 455,566,006 | 1,421,168,645 | 6% | -3.20% |
| Total | 4,585,587,794 | 14,547,438,872 | -0.80% | -4.40% |
From January to December in 2015, China's taps, cocks, valves for pipes & tanks export value reached USD 3,375,000,000, growing 14.9% on year.
Export Destinations for China's Taps, Cocks, Valves for Pipes & Tanks in 2015
| No. | Country/Region | Volume | Value(USD) | on Year | |
| Volume | Value | ||||
| 1 | United States | 742,415,591 | 3,383,507,789 | 1.20% | -5.70% |
| 2 | Germany | 144,664,537 | 633,904,048 | -12.20% | -2.80% |
| 3 | Japan | 120,003,375 | 630,106,625 | 10.80% | -8.90% |
| 4 | United Kingdom | 147,986,416 | 602,334,090 | -5.70% | 0.40% |
| 5 | Russia | 154,836,448 | 468,026,117 | -23.40% | -21.80% |
| 6 | Korea | 142,694,258 | 402,985,858 | -9.90% | 2.10% |
| 7 | Italy | 140,008,393 | 365,143,087 | 1.70% | -12.70% |
| 8 | Spain | 75,177,444 | 336,250,680 | -1.60% | 4.70% |
| 9 | Hong Kong | 69,463,480 | 333,399,000 | -10.80% | -0.90% |
| 10 | Canada | 40,180,057 | 313,458,770 | -11.20% | -9.40% |
From January to December in 2015, the top export destinations of China's taps, cocks, valves for pipes & tanks were the United States, Germany and Japan. In 2015, China exports to Vietnam grew faster than exports to other markets and the growth was 17.5% on year.
Export Origins of China's Taps, Cocks, Valves for Pipes & Tanks in 2015
| No. | District | Volume | Value(USD) | on Year | |
| Volume | Value | ||||
| 1 | Zhejiang | 2,111,354,660 | 5,403,031,355 | -1.10% | -1.40% |
| 2 | Guangdong | 328,668,378 | 2,399,904,812 | -17.20% | 3.10% |
| 3 | Jiangsu | 661,014,558 | 1,737,890,046 | -1.80% | -12.50% |
| 4 | Fujian | 441,781,346 | 1,294,831,257 | -1.10% | -5.90% |
| 5 | Shanghai | 260,618,287 | 966,679,588 | -14.50% | -12.30% |
| 6 | Shandong | 433,131,460 | 598,409,987 | 14.30% | -7.20% |
| 7 | Liaoning | 46,737,022 | 375,021,570 | -9.60% | -11.70% |
| 8 | Tianjin | 22,754,173 | 333,156,131 | -15.30% | -17.20% |
| 9 | Beijing | 13,024,902 | 330,932,274 | 9% | -1.40% |
| 10 | Hebei | 172,137,884 | 257,007,213 | 59.90% | -9.40% |
The top export origins of China's taps, cocks, valves for pipes & tanks were Zhejiang province and Guangdong province in 2015. Zhejiang province exported USD 5,403,031,355, making the largest export origin in China. The average export price from Sichuan was the highest.


