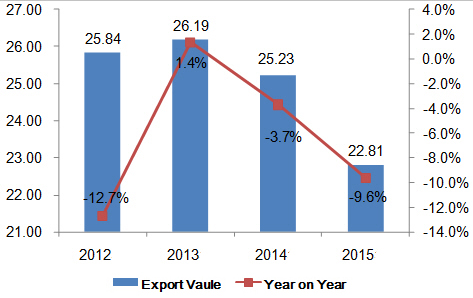
Annual Trend of China's Animal Hair & Fabric Thereof Export Value from 2012 to 2015

From 2012 to 2015, China's animal hair & fabric thereof export value trended down. The export value in 2015 was USD 2,281,000,000, falling 11.7% from 2014.
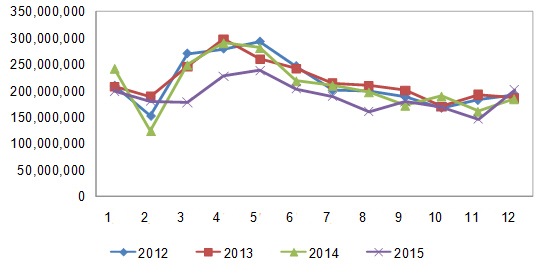
Monthly Trend of China's Animal Hair & Fabric Thereof Export Value from 2012 to 2015

China's animal hair & fabric thereof export value surged in the second quarter during the period from 2012 to 2015. In 2015, the export value peaked in May and hit a trough in November.
China's Animal Hair & Fabric Thereof Export Volume & Value in 2015
| Month | Volume | Value(USD) | on Year | |
| Volume | Value | |||
| January | 13,454,501 | 200,261,895 | -22.10% | -17.40% |
| February | 12,699,603 | 180,799,661 | 63.40% | 45.40% |
| March | 11,696,204 | 178,385,247 | -25.60% | -28.30% |
| April | 16,817,992 | 227,750,751 | -18.10% | -21.70% |
| May | 18,858,180 | 238,866,534 | -11.20% | -15.10% |
| June | 16,297,085 | 204,174,711 | -5.30% | -6.10% |
| July | 14,751,617 | 189,902,577 | -4.60% | -9.70% |
| August | 12,339,316 | 161,338,222 | -17.60% | -18.40% |
| September | 13,459,662 | 180,142,886 | 6.50% | 4.40% |
| October | 13,772,503 | 170,441,972 | -7.10% | -10.30% |
| November | 12,660,761 | 146,830,156 | -1.60% | -8.90% |
| December | 14,793,773 | 202,357,664 | 3.90% | 9.50% |
| Total | 171,601,197 | 2,281,252,276 | -7.10% | -9.50% |
China's animal hair & fabric thereof export value reached USD 2,281,000,000 in 2015, falling 19.5% on year.
Markets for China's Animal Hair & Fabric Thereof Exports in 2015
| No. | Country/Region | Volume | Value(USD) | on Year | |
| Volume | Value | ||||
| 1 | Hong Kong | 16,217,940 | 427,300,280 | -11.90% | -5.50% |
| 2 | Italy | 13,936,810 | 333,273,604 | -13.40% | -13.90% |
| 3 | Japan | 19,415,877 | 233,852,786 | -0.90% | -3.40% |
| 4 | Vietnam | 16,536,394 | 194,707,707 | 24.10% | 15.30% |
| 5 | Korea | 13,715,200 | 170,123,245 | 8.80% | 6.40% |
| 6 | Germany | 8,294,693 | 99,226,778 | -28.30% | -31.10% |
| 7 | Madagascar | 564,474 | 76,054,392 | 14.50% | 9% |
| 8 | Indonesia | 9,236,988 | 73,175,487 | 1.80% | 0% |
| 9 | Cambodia | 2,586,993 | 72,567,058 | 31.80% | 0.50% |
| 10 | Turkey | 6,083,633 | 59,478,331 | -43% | -39.40% |
| 11 | Bangladesh | 2,728,488 | 43,717,966 | -24.20% | -20.50% |
| 12 | United Kingdom | 5,850,299 | 42,483,448 | 37.70% | -20.30% |
| 13 | India | 11,715,856 | 41,831,984 | 14.40% | -2.70% |
| 14 | United States | 3,045,263 | 37,722,094 | 1.80% | -2.90% |
| 15 | Thailand | 1,990,536 | 28,501,216 | -24.80% | -35.30% |
| 16 | Nepal | 2,048,178 | 28,489,441 | -19.40% | -23.50% |
| 17 | Canada | 2,300,828 | 19,381,955 | 3.30% | -4.20% |
| 18 | Myanmar | 1,788,377 | 17,080,625 | -15.20% | -3.90% |
| 19 | Russia | 1,690,646 | 16,744,424 | -37.20% | -38.70% |
| 20 | Mexico | 1,344,349 | 16,057,231 | -44.80% | -42.90% |

Major markets for China's animal hair & fabric thereof export included Hong Kong, Italy, Japan, Vietnam, Korea, Germany, Madagascar, Indonesia, Cambodia, Turkey etc in 2015.
Hong Kong, Italy and Japan were major markets for China's animal hair & fabric thereof exports. China's animal hair & fabric thereof exports to Hong Kong declined in 2015 on year and it accounted for 18.7% of China's total animal hair & fabric thereof exports.
China's Animal Hair & Fabric Thereof Export Origins in 2015
| No. | Districts | Volume | Value(USD) | on Year | |
| Volume | Value | ||||
| 1 | Jiangsu | 88,499,946 | 977,405,153 | -10.50% | -10.80% |
| 2 | Zhejiang | 24,626,824 | 304,889,857 | -8.40% | -15.50% |
| 3 | Hebei | 24,146,622 | 262,697,681 | 7.70% | -16.50% |
| 4 | Ningxia | 1,520,956 | 159,984,844 | 12.20% | -7.30% |
| 5 | Inner Mongolia | 3,085,274 | 149,760,408 | 15.60% | 9.20% |
| 6 | Guangdong | 5,601,819 | 107,775,312 | -11.90% | -11.70% |
| 7 | Shanghai | 6,719,769 | 86,723,092 | -4.60% | -12.10% |
| 8 | Shandong | 6,851,004 | 74,360,204 | -23.60% | -27.10% |
| 9 | Anhui | 1,457,797 | 35,794,920 | 14.50% | 77.70% |
| 10 | Guangxi | 178,696 | 33,748,474 | 89248% | 1319746.50% |
| 11 | Tianjin | 1,072,068 | 18,879,925 | 11.60% | 11.20% |
| 12 | Liaoning | 1,725,668 | 14,978,885 | -14.80% | 53.50% |
| 13 | Beijing | 643,922 | 10,625,666 | -32.80% | -44% |
| 14 | Hubei | 1,325,739 | 9,377,254 | 40.60% | 27.70% |
| 15 | Shanxi | 66,880 | 7,630,704 | -56.70% | -62.80% |
| 16 | Gansu | 718,516 | 6,692,789 | -10.80% | -6.60% |
| 17 | Tibet | 1,659,832 | 5,424,477 | -9.10% | -15.40% |
| 18 | Qinghai | 168,833 | 3,662,367 | 238.60% | -35.20% |
| 19 | Jiangxi | 271,185 | 3,597,872 | 862.10% | 1823.70% |
| 20 | Xinjiang | 141,553 | 1,560,597 | -37.50% | -24.10% |
Zhejiang, Hebei and Jiangsu were China's major animal hair & fabric thereof export origins. In 2015, their animal hair & fabric thereof export value accounted for 61.1% of China's total. In China's top 20 export origins, Guangxi's animal hair & fabric thereof export value grew 1319746.5% on year.


