Distribution of China Iron & Steel Tube or Pipe Fittings Export Enterprises
| No. | Region | Export Value | Y-o-Y | ||
| Volume(kg) | Value(USD) | Volume | Value | ||
| 1 | Shandong | 317,753,483 | 622,003,325 | 2% | -0.70% |
| 2 | Jiangsu | 117,158,821 | 556,189,452 | -20.70% | -18.30% |
| 3 | Hebei | 308,615,397 | 530,912,694 | -1.70% | -3.70% |
| 4 | Zhejiang | 102,222,394 | 492,870,295 | -1% | -0.60% |
| 5 | Liaoning | 103,763,757 | 233,189,587 | -6.20% | -6.10% |
| 6 | Shanghai | 45,245,602 | 228,570,654 | -12.30% | -6.70% |
| 7 | Shanxi | 126,151,623 | 191,984,913 | -8.50% | -15.20% |
| 8 | Guangdong | 34,860,395 | 168,625,740 | 1.20% | -12.40% |
| 9 | Tianjin | 51,833,940 | 113,312,872 | -28.50% | -29.90% |
| 10 | Beijing | 28,913,619 | 79,496,226 | -14.30% | -12.10% |
From January to October, Shandong province, Jiangsu province, Hebei province and Zhejiang province were the main regions where China’s iron & steel tube or pipe fittings export enterprise located. The four regions’total export value accounted 63.9% of the total.
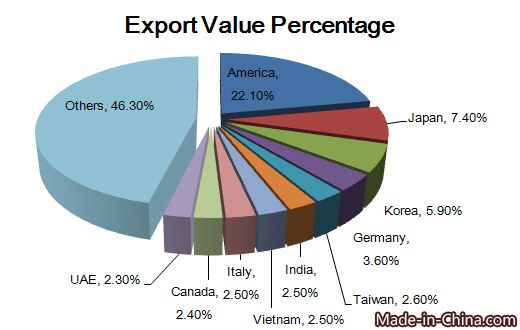
Distributions of Major Countries/Regions for China’s Iron & Steel Tube or Pipe Fittings Export
| No. | Country/Region | Export Value | Y-o-Y | ||
| Volume(kg) | Value(USD) | Volume | Value | ||
| 1 | America | 262,405,119 | 760,037,655 | -15.50% | -15.70% |
| 2 | Japan | 73,530,179 | 255,860,849 | -3.90% | -6.60% |
| 3 | Korea | 98,726,719 | 202,575,431 | 0.40% | -3.20% |
| 4 | Germany | 33,740,063 | 124,682,103 | -8.40% | -14.90% |
| 5 | Taiwan | 41,900,765 | 88,700,668 | 18.10% | 6.80% |
| 6 | India | 25,771,717 | 85,991,503 | -9.60% | 15.60% |
| 7 | Vietnam | 21,286,746 | 85,743,103 | 35.30% | -20.50% |
| 8 | Italy | 33,097,857 | 85,529,663 | -9.60% | -14.80% |
| 9 | Canada | 30,308,034 | 81,496,663 | -10.90% | -16.60% |
| 10 | UAE | 33,972,360 | 79,160,731 | 23.10% | 6.20% |

From January to October in 2015, America, Japan, Korea, Germany, Taiwan, India, Vietnam, Italy, Canada and UAE were major countries for China’s iron & steel tube or pipe fittings export. America was the largest export market for China during this period. The value of iron & steel tube or pipe fittings China exported to America accounted for 22.1% of the total.
Major Countries/Regions in Need of Iron & Steel Tube or Pipe Fittings
| Importing Country/Region | Import Value | ||
| 2012 | 2013 | 2014 | |
| America | 2,458,369,000 | 2,276,280,000 | 2,444,767,000 |
| Germany | 1,190,464,000 | 1,173,566,000 | 1,163,191,000 |
| Canada | 1,047,183,000 | 952,239,000 | 998,106,000 |
| China | 737,468,000 | 830,333,000 | 842,207,000 |
| Japan | 775,537,000 | 700,109,000 | 743,673,000 |
Unit: USD
From 2012 to 2014, major importing countries were America, Germany, China and Japan. As the largest importing country, America’s import value was USD 2445 million in 2014.
Major Iron & Steel Tube or Pipe Fittings Exporting Countries
| Exporting Country/Region | Export Value | ||
| 2012 | 2013 | 2014 | |
| China | 4,194,738,000 | 4,036,891,000 | 4,583,221,000 |
| Italy | 2,194,194,000 | 2,322,858,000 | 2,192,325,000 |
| America | 2,002,058,000 | 2,066,270,000 | 2,100,106,000 |
| Germany | 1,752,806,000 | 1,839,543,000 | 1,887,316,000 |
| Korea | 1,304,515,000 | 1,167,673,000 | 1,129,261,000 |
Unit: USD
Main iron & steel tube or pipe fittings exporting countries included China, Italy, America, Germany and Korea. As the largest exporting country, China’s export value was USD 4583 million in 2015.


