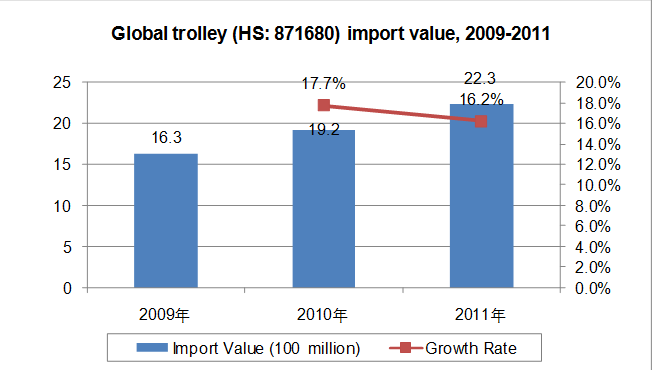
Annual total import value of global trolley had maintained sustainable rise from 2009 to 2011. In 2011, it amounted to 2.23 billion US dollars, getting a year-on-year increase of 16.2% and 1.5% decrease of growth compared to that of 2010.
2009-2011 Import Value of Major Countries/Regions Demanding for Trolley
| No. | Import Country/Region | Import Value (thousand USD) | Growth Rate of 2011 Compared with 2009 | ||
| 2009 | 2010 | 2011 | |||
| 1 | USA | 271,430 | 331,716 | 372,479 | 37.20% |
| 2 | Germany | 138,800 | 147,690 | 174,442 | 25.70% |
| 3 | Japan | 103,023 | 111,407 | 132,816 | 28.90% |
| 4 | United Kingdom | 81,699 | 92,583 | 124,846 | 52.80% |
| 5 | France | 78,270 | 87,477 | 112,246 | 43.40% |
| 6 | Canada | 77,479 | 89,226 | 110,116 | 42.10% |
| 7 | Russian Federation | 40,914 | 69,570 | 90,211 | 120.50% |
| 8 | Australia | 60,866 | 62,101 | 83,519 | 37.20% |
| 9 | Netherlands | 53,090 | 63,863 | 69,798 | 31.50% |
| 10 | Belgium | 40,977 | 46,870 | 50,353 | 22.90% |
| 11 | Italy | 32,439 | 43,338 | 46,845 | 44.40% |
| 12 | Austria | 34,141 | 35,072 | 42,064 | 23.20% |
| 13 | Sweden | 33,643 | 38,530 | 41,312 | 22.80% |
| 14 | Israel | 24,760 | 41,637 | 40,816 | 64.80% |
| 15 | Mexico | 27,060 | 40,339 | 40,439 | 49.40% |
| 16 | Switzerland | 36,175 | 33,301 | 40,379 | 11.60% |
| 17 | Norway | 22,640 | 24,634 | 29,409 | 29.90% |
| 18 | Spain | 25,355 | 30,603 | 29,034 | 14.50% |
| 19 | Denmark | 20,950 | 23,140 | 22,933 | 9.50% |
| 20 | China | 11,121 | 15,445 | 21,935 | 97.20% |
USA, Germany, Japan, United Kingdom and France are world's top five countries holding large demand for trolley, and their import value in 2011 were up 37.2%, 25.7%, 28.9%, 52.8%,and 43.4% respectively compared to 2009. Among the top 20 countries, the Russian Federation caught the largest increase in import value, a 120.5% rise compared to that of 2009.
2009-2011 Market Share of Major Countries/Regions Demanding for Trolley
| No. | Import Country/Region | Proportion of Import Value | ||
| 2009 | 2010 | 2011 | ||
| 1 | USA | 16.70% | 17.30% | 16.70% |
| 2 | Germany | 8.50% | 7.70% | 7.80% |
| 3 | Japan | 6.30% | 5.80% | 6.00% |
| 4 | United Kingdom | 5.00% | 4.80% | 5.60% |
| 5 | France | 4.80% | 4.60% | 5.00% |
| 6 | Canada | 4.80% | 4.70% | 4.90% |
| 7 | Russian Federation↑ | 2.50% | 3.60% | 4.00% |
| 8 | Australia | 3.70% | 3.20% | 3.70% |
| 9 | Netherlands | 3.30% | 3.30% | 3.10% |
| 10 | Belgium↓ | 2.50% | 2.40% | 2.30% |
| 11 | Italy | 2.00% | 2.30% | 2.10% |
| 12 | Austria | 2.10% | 1.80% | 1.90% |
| 13 | Sweden↓ | 2.10% | 2.00% | 1.90% |
| 14 | Israel | 1.50% | 2.20% | 1.80% |
| 15 | Mexico | 1.70% | 2.10% | 1.80% |
| 16 | Switzerland | 2.20% | 1.70% | 1.80% |
| 17 | Norway | 1.40% | 1.30% | 1.30% |
| 18 | Spain | 1.60% | 1.60% | 1.30% |
| 19 | Denmark↓ | 1.30% | 1.20% | 1.00% |
| 20 | China↑ | 0.70% | 0.80% | 1.00% |
Note: “↑”represents the proportion of import value took in global total imports obtained continuous increase from 2009 to 2011, while”↓” represents continuous decrease.
From 2009 to 2011, countries which kept continuous increase in the proportion of import value took in global total imports were the Russian Federation (1.5% up in 2011 compared to that of 2009), China (10.3% up in 2011 compared to that of 2009), while those kept continuous decline were Belgium (0.2% down in 2011 compared to that of 2009), Sweden (0.2% down in 2011 compared to that of 2009), Denmark (0.3% down in 2011 compared to that of 2009).
2009-2011 Export Value of World’s Major Export Countries/Regions for Global Trolley Imports
| No. | Export Country/Region | Export Value(thousand USD) | Growth Rate of 2011 Compared with 2009 | ||
| 2009 | 2010 | 2011 | |||
| 1 | China | 694,809 | 899,342 | 1,097,695 | 58.00% |
| 2 | Germany | 257,053 | 266,552 | 346,091 | 34.60% |
| 3 | USA | 120,229 | 136,348 | 174,259 | 44.90% |
| 4 | France | 71,739 | 69,261 | 65,255 | -9.00% |
| 5 | Poland | 43,794 | 46,313 | 61,764 | 41.00% |
| 6 | Netherlands | 33,084 | 38,238 | 54,128 | 63.60% |
| 7 | Canada | 41,845 | 47,367 | 53,267 | 27.30% |
| 8 | Sweden | 39,252 | 37,550 | 49,223 | 25.40% |
| 9 | Italy | 36,530 | 41,442 | 45,565 | 24.70% |
| 10 | Taiwan | 33,676 | 30,324 | 37,060 | 10.00% |
| 11 | United Kingdom | 21,891 | 24,091 | 33,946 | 55.10% |
| 12 | Mexico | 20,786 | 30,673 | 32,530 | 56.50% |
| 13 | Japan | 23,313 | 25,465 | 27,617 | 18.50% |
| 14 | Finland | 23,322 | 27,883 | 27,134 | 16.30% |
| 15 | Belgium | 18,634 | 21,753 | 23,996 | 28.80% |
| 16 | Czech Republic | 13,300 | 18,345 | 20,497 | 54.10% |
| 17 | Turkey | 13,911 | 16,316 | 17,673 | 27.00% |
| 18 | South Korea | 7,476 | 13,879 | 17,338 | 131.90% |
| 19 | Denmark | 13,357 | 13,056 | 16,655 | 24.70% |
| 20 | Austria | 14,179 | 13,804 | 14,706 | 3.70% |
The world's top five export supply countries for trolley are China, Germany, USA, France, Poland, whose export amount increased by 58.0%, 34.6%, 44.9%,-9.0% and 41.0% respectively in 2011 compared with 2009.
2009-2011 Market Share of World's Major Export Countries/Regions
| No. | Export Country/Region | Proportion of Export Value | ||
| 2009 | 2010 | 2011 | ||
| 1 | China↑ | 40.30% | 45.20% | 45.70% |
| 2 | Germany | 14.90% | 13.40% | 14.40% |
| 3 | USA | 7.00% | 6.90% | 7.30% |
| 4 | France↓ | 4.20% | 3.50% | 2.70% |
| 5 | Poland | 2.50% | 2.30% | 2.60% |
| 6 | Netherlands | 1.90% | 1.90% | 2.30% |
| 7 | Canada | 2.40% | 2.40% | 2.20% |
| 8 | Sweden | 2.30% | 1.90% | 2.00% |
| 9 | Italy | 2.10% | 2.10% | 1.90% |
| 10 | Taiwan | 2.00% | 1.50% | 1.50% |
| 11 | United Kingdom | 1.30% | 1.20% | 1.40% |
| 12 | Mexico | 1.20% | 1.50% | 1.40% |
| 13 | Japan | 1.40% | 1.30% | 1.20% |
| 14 | Finland | 1.40% | 1.40% | 1.10% |
| 15 | Belgium | 1.10% | 1.10% | 1.00% |
| 16 | Czech Republic | 0.80% | 0.90% | 0.90% |
| 17 | Turkey | 0.80% | 0.80% | 0.70% |
| 18 | South Korea | 0.40% | 0.70% | 0.70% |
| 19 | Denmark | 0.80% | 0.70% | 0.70% |
| 20 | Austria↓ | 0.80% | 0.70% | 0.60% |
Note:" ↑"indicates that the index grow continuously from 2009 to 2011," ↓"indicates that the index decline continuously from 2009 to 2011
Among the above 20 exporters for trolley, the market share of Chinese trolley export value had continued to rise from 2009 to 2011 (a rise of 5.4% in 2011 compared to that of 2009), while France (down 1.5% in 2011 compared to 2009) and Austria kept declining (a decrease of 0.2% in 2011 compared to 2009) .


