Note:
| HS Code | Product Name |
| 9206 | Percussion musical instruments (for example, drums, xylophones, cymbals, castanets, maracas), the following article hereinafter referred to as "percussion instrument". |
China Percussion Instrument Export Volume and Value from Jan. to October in 2013
| Month | Volume (Set) | Value (USD) | Compared to the Same Period of Last Year | |
|
|
|
| Volume | Value |
| January | 815,681 | 8,941,716 | -22.1% | 9.4% |
| February | 1,044,721 | 8,287,438 | 220.7% | 39.3% |
| March | 331,030 | 7,077,461 | -60% | -30.1% |
| April | 593,589 | 9,721,056 | -4.2% | -10.8% |
| May | 769,297 | 10,574,986 | -27.7% | -16% |
| June | 611,698 | 9,906,958 | -38.1% | -18.8% |
| July | 1,215,472 | 13,527,652 | 5.3% | 10.4% |
| August | 834,592 | 12,050,637 | -56.6% | -23.6% |
| September | 852,871 | 13,801,674 | -19.8% | -16.7% |
| October | 1,423,445 | 14,754,664 | 36% | 9.1% |
| Jan. to October Total | 8,492,396 | 108,644,242 | -15.6% | -8% |
The export volume of China percussion instrument from Jan. to October in 2013 amounted to 8.4924 million sets, with a decrease of 15.6%, while the export value amounted to 109 million US dollars, with a decrease of 8%.
China Percussion Instrument Major Export Countries/Regions Distribution from Jan. to October in 2013
| No. | Countries | Volume (Set) | Value (USD) | Compared to the Same Period of Last Year | |
|
|
|
|
| Volume | Volume |
| 1 | USA | 1,668,786 | 28,162,306 | -5.4% | 0.4% |
| 2 | Nigeria | 142,958 | 6,724,704 | 39.2% | -11.4% |
| 3 | Germany | 424,908 | 6,194,304 | -74.7% | -30.7% |
| 4 | Netherlands | 1,093,480 | 5,633,876 | 137.5% | 59.3% |
| 5 | Brazil | 439,219 | 5,199,990 | 127.9% | -22% |
| 6 | Japan | 455,920 | 4,017,947 | 18.2% | -2.6% |
| 7 | Indonesia | 90,278 | 3,381,370 | 29.2% | 48.2% |
| 8 | South Korea | 703,843 | 2,988,468 | 66.6% | 6.9% |
| 9 | Mexico | 149,862 | 2,987,073 | 0 | -36% |
| 10 | Chile | 245,085 | 2,817,442 | 40.4% | 6.4% |
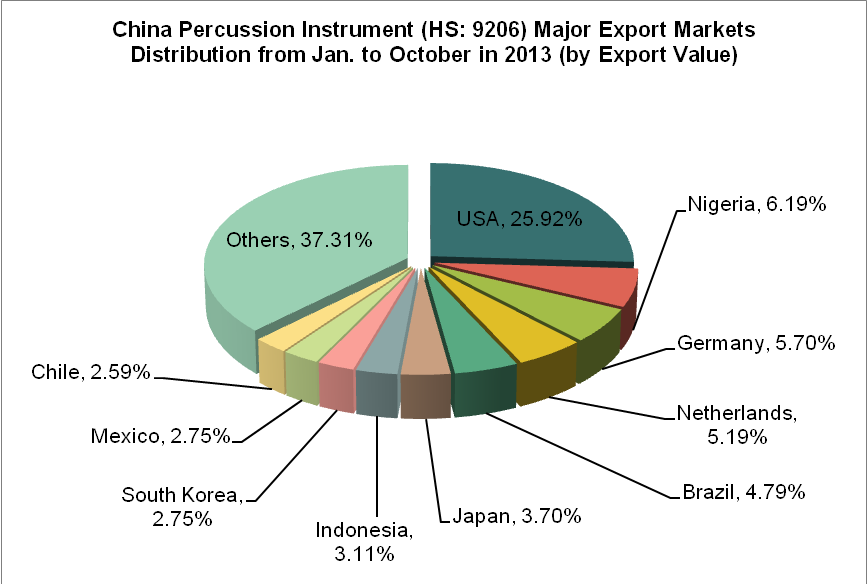
China's main export markets of percussion instrument were the United States, Nigeria, Germany, the Netherlands and Brazil from Jan. to October in 2013. The export value to the five countries accounted for 25.92%, 6.19%, 5.70%, 5.19% and 4.79% of our country's total export value of the product respectively and totally accounted for 47.78%.
China Percussion Instrument Export Source Areas from Jan. to October in 2013
| No. | Regions | Volume (Set) | Value (USD) | Compared to the Same Period of Last Year | |
|
|
|
|
| Volume | Volume |
| 1 | Tianjin | 1,837,389 | 50,558,767 | -6.8% | -9.2% |
| 2 | Guangdong | 1,144,289 | 17,369,894 | -18.7% | -8.6% |
| 3 | Hebei | 2,004,306 | 13,423,905 | -1.3% | 15.9% |
| 4 | Zhejiang | 2,341,869 | 10,495,485 | -26.7% | -18.7% |
| 5 | Shanghai | 180,290 | 4,578,107 | 51.4% | 21.9% |
| 6 | Jiangsu | 210,041 | 3,504,135 | -37.1% | -25.3% |
| 7 | Hubei | 80,336 | 2,580,944 | -26.3% | -11.8% |
| 8 | Fujian | 83,611 | 1,994,934 | -30.9% | -27.8% |
| 9 | Shandong | 102,510 | 898,328 | 42.3% | -20.2% |
| 10 | Beijing | 33,476 | 590,999 | -22.5% | -28.3% |
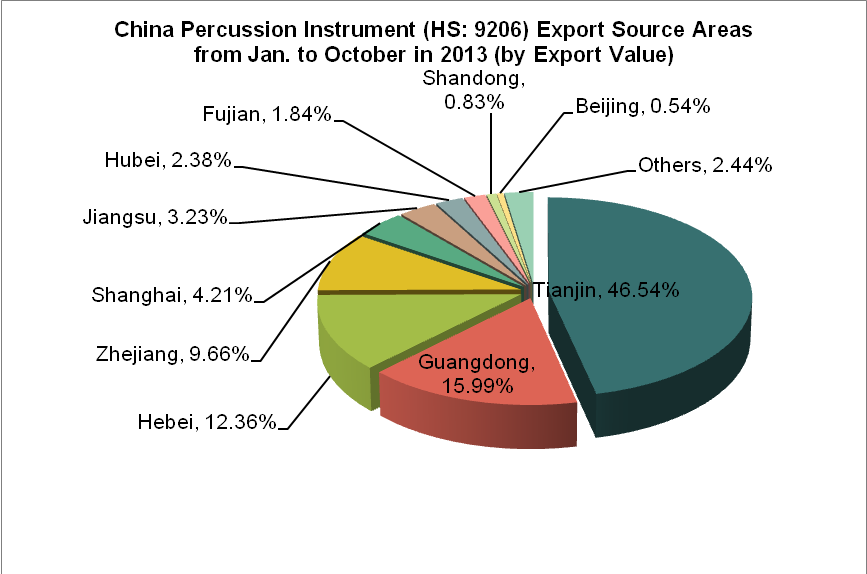
Tianjin, Guangdong and Hebei are our country's percussion instrument major export source areas. From Jan. to October in 2013, the export value of the above four areas totally accounted for 84.54% of the total export value of the product.
(Source: China Customs Network)


