The Import Value Trends of American Model Steel Doors and Windows from 2010 to 2012
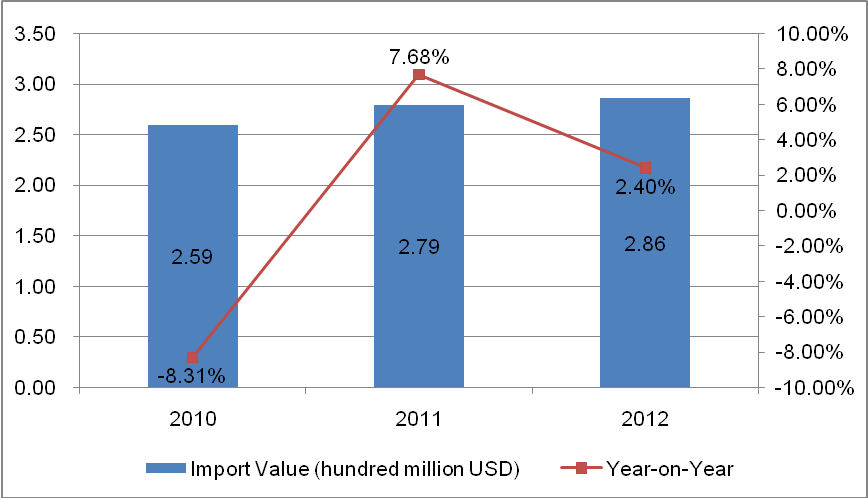
The import value of USA model steel doors and windows showed an increasing trend from 2010 to 2012; the three years total import value were respectively 259 million dollars, 279 million dollars and 286 million dollars. And it increased by 2.4% in 2012.
The Major Import Countries / Regions of American Model Steel Doors and Windows from 2010 to 2012
| No. | Export Countries / Regions | Import Value(Thousand USD) | 2012 Import Value Increase Compared to 2010 | ||
|
|
| 2010 | 2011 | 2012 |
|
| 1 | Canada | 106,109 | 113,323 | 115,914 | 9.24% |
| 2 | China | 59,560 | 59,239 | 78,216 | 31.32% |
| 3 | Mexico | 52,187 | 53,947 | 42,460 | -18.64% |
| 4 | Taiwan | 2,328 | 9,579 | 12,305 | 428.57% |
| 5 | Italy | 8,192 | 7,185 | 7,403 | -9.63% |
| 6 | United Kingdom | 4,198 | 4,449 | 5,351 | 27.47% |
| 7 | Netherlands | 7,326 | 3,743 | 5,297 | -27.70% |
| 8 | Germany | 4,211 | 5,776 | 5,002 | 18.78% |
| 9 | Norway | 1,817 | 2,868 | 3,477 | 91.36% |
| 10 | Switzerland | 1,727 | 3,425 | 2,760 | 59.81% |
| 11 | Korea | 1,290 | 2,516 | 1,208 | -6.36% |
| 12 | Poland | 2,031 | 1,855 | 1,005 | -50.52% |
| 13 | Finland | 2,767 | 1,425 | 883 | -68.09% |
| 14 | France | 439 | 524 | 624 | 42.14% |
| 15 | Sweden | 609 | 1,110 | 489 | -19.70% |
| 16 | Australia | 12 | 413 | 431 | 3491.67% |
| 17 | Japan | 174 | 322 | 419 | 140.80% |
| 18 | Spain | 494 | 204 | 411 | -16.80% |
| 19 | Denmark | 1,456 | 3,140 | 321 | -77.95% |
| 20 | Russian Federation | 94 | 26 | 221 | 135.11% |
The top three import countries of USA model steel doors and windows were Canada, China and Mexico from 2010 to 2012. Among the top 20 import countries in 2012, the import value of Australia showed the highest increase of 3491.67% compared to 2010,
followed by Taiwan, with 428.57% growth compared to 2010. And Japan ranked the third place, with an increase of 140.80% compared to 2010.
The Market Share of Model Steel Doors and Windows in Major American Import Countries / Regions from 2010 to 2012
| No. | Import Countries / Regions | Import Value Percentage | ||
|
|
| 2010 | 2011 | 2012 |
| 1 | Canada↓ | 40.95% | 40.61% | 40.57% |
| 2 | China | 22.99% | 21.23% | 27.38% |
| 3 | Mexico↓ | 20.14% | 19.33% | 14.86% |
| 4 | Taiwan↑ | 0.90% | 3.43% | 4.31% |
| 5 | Italy | 3.16% | 2.58% | 2.59% |
| 6 | United Kingdom | 1.62% | 1.59% | 1.87% |
| 7 | Netherlands | 2.83% | 1.34% | 1.85% |
| 8 | Germany | 1.63% | 2.07% | 1.75% |
| 9 | Norway↑ | 0.70% | 1.03% | 1.22% |
| 10 | Switzerland | 0.67% | 1.23% | 0.97% |
| 11 | Korea | 0.50% | 0.90% | 0.42% |
| 12 | Poland↓ | 0.78% | 0.66% | 0.35% |
| 13 | Finland↓ | 1.07% | 0.51% | 0.31% |
| 14 | France↑ | 0.17% | 0.19% | 0.22% |
| 15 | Sweden | 0.24% | 0.40% | 0.17% |
| 16 | Australia | / | 0.15% | 0.15% |
| 17 | Japan↑ | 0.07% | 0.12% | 0.15% |
| 18 | Spain | 0.19% | 0.07% | 0.14% |
| 19 | Denmark | 0.56% | 1.13% | 0.11% |
| 20 | Russian Federation | 0.04% | 0.01% | 0.08% |
Note: ↑represents it continued to rise from 2010 to 2012, ↓represents it continued to decline from 2010 to 2012.
In terms of market share from 2010 to 2012, the countries / regions whose import value continued to rise were Taiwan, Norway, France and Japan; the countries whose import value continued to decline were Canada, Mexico, Poland and Finland.
The Major Import Countries / Regions of American Model Steel Doors and Windows from Jan. to Jun. in 2013
| Countries / Regions | Import Value from Jan. to Jun. in 2013 (Thousand USD) | Year on Year | Percentage |
| Total | 149,545 | 6.68% | 100.00% |
| Canada | 59,322 | 9.22% | 39.67% |
| China | 39,390 | -6.24% | 26.34% |
| Mexico | 24,151 | 19.43% | 16.15% |
| Taiwan | 6,148 | -10.83% | 4.11% |
| Italy | 4,835 | 89.83% | 3.23% |
| Germany | 2,811 | 19.21% | 1.88% |
| Netherlands | 2,228 | -30.61% | 1.49% |
| United Kingdom | 1,909 | -22.90% | 1.28% |
| Poland | 1,729 | 235.73% | 1.16% |
| Norway | 1,483 | 5.25% | 0.99% |
American total import value of model steel doors and windows were 150 million dollars from Jan. to Jun. in 2013. Among them, 59.322 million dollars were imported from Canada which accounted for 39.67% of the total value; Followed by China, which accounted for 26.34%. And Mexico accounted for 16.15%, ranking the third place.
Source: UN COMTRADE


