India's Knitting Machinery (HS: 8447) Imports Trend, 2009-2011
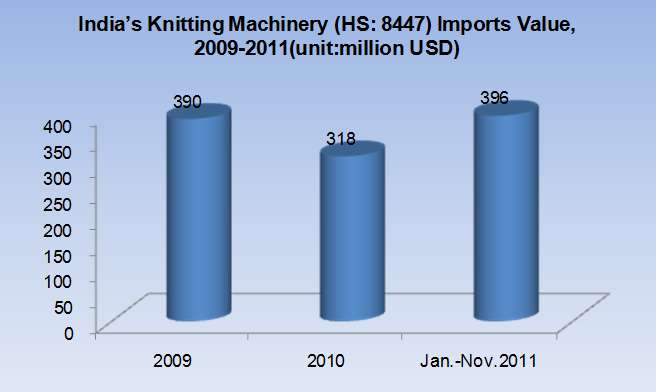
2009-2011, India knitting machinery imports trends shaped a "V". The total import value of 2011 was about $ 396 million, getting a 24.46% year-on-year growth.
Note: The above figures were projections based on the import and export between the national data.
Monthly Trend of India's Knitting Machinery Import Value, Jan.-Nov. 2011
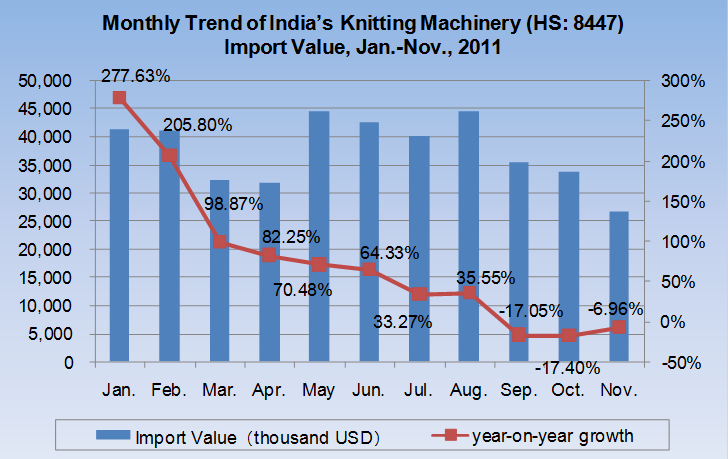
In the first eight months of 2011, India's knitting machinery imports year-on-year growth was all positive, and then in September, the figure became negative.
Main Supply Countries/Regions for India's Knitting Machinery Import, Jan.-Nov. 2011
| No. | Countries/Regions | Import Value9(thousand USD) | Year-on-year growth (±%) | Market Share |
| 1 | China | 259,077 | 66.16% | 62.76% |
| 2 | Germany | 47,811 | 55.66% | 11.58% |
| 3 | Japan | 22,398 | -10.26% | 5.43% |
| 4 | Switzerland | 15,515 | -34.07% | 3.76% |
| 5 | Taiwan | 15,264 | -24.78% | 3.70% |
| 6 | Italy | 12,432 | 184.35% | 3.01% |
| 7 | South Korea | 8,696 | 14.21% | 2.11% |
| 8 | Singapore | 6,228 | -8.77% | 1.51% |
| 9 | The USA | 4,150 | 73.35% | 1.01% |
| 10 | Spain | 2,106 | 130.16% | 0.51% |
China is the largest supply country for India's knitting machinery imports, accounting for 62.76% of Indian total imports. Indian knitting machinery imports from China in 2011 increased by 66.16%, about 41.7% higher than Indian imports of other kind of such products (24.46%).
Turkey's Knitting Machinery Imports Trend, 2009-2011
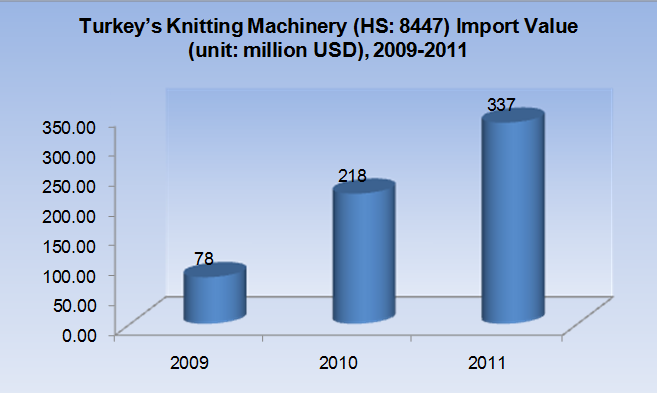
Turkey knitting machinery imports rose year by year from 2009 to 2011.In 2011, the total imports was about $ 337 million, obtaining a year-on-year growth of 54.78%.
Monthly Trend of Turkey's Knitting Machinery Import Value, 2011-2012
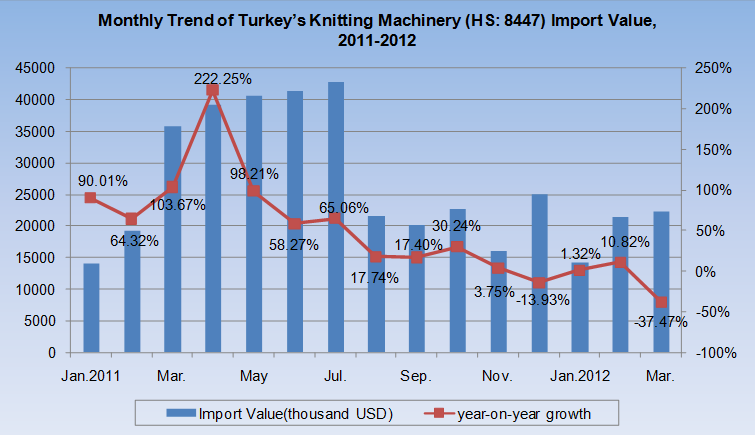
From Jan. 2011 to Mar.2012, 13 months got positive growth over the previous year and 2 months got negative.
Main Supply Countries/Regions for Turkey's Knitting Machinery Imports
| No. | Countries/Regions | Import Value9(thousand USD) | Year-on-year growth (±%) | Market Share |
| 1 | Germany | 86,470 | 65.12% | 25.64% |
| 2 | Japan | 85,819 | 32.85% | 25.44% |
| 3 | Italy | 82,730 | 68.55% | 24.53% |
| 4 | Switzerland | 39,752 | 155.59% | 11.79% |
| 5 | China | 14,872 | 262.55% | 4.41% |
| 6 | South Korea | 11,737 | 12.67% | 3.48% |
| 7 | Taiwan | 10,790 | -43.26% | 3.20% |
| 8 | The UK | 1,911 | 607.78% | 0.57% |
| 9 | The USA | 1,648 | -0.78% | 0.49% |
| 10 | Czech Republic | 399 | 13.03% | 0.12% |
Germany was the top one supply country for Turkey's knitting machinery imports, accounting for 25.64% of the total, and China ranked fifth, accounting for 4.41% of the market share. Turkey's knitting machinery imports from China in 2011 increased by 262.55%, 207.77% higher than the growth of Turkey's total imports of such products (54.78%).
Italy's Knitting Machinery Imports Trend, 2009-2011
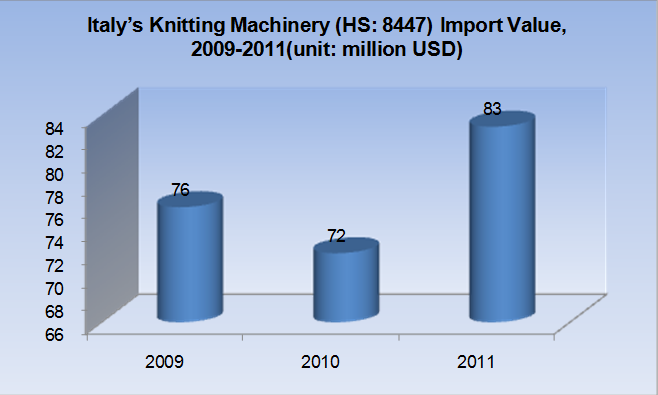
In 2009-2011, the Italy knitting machinery imports trend showed a "V" shape. In 2011, the total import amount was about $ 83 million, an increase of 15.08%.
Monthly Trend of Italy's Knitting Machinery Import Value, 2011-2012
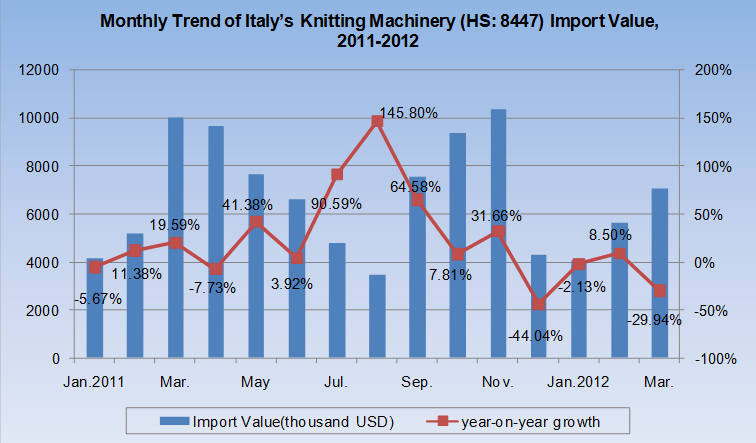
From Jan. 2011 to Mar.2012, ten months' knitting machinery imports increased while the other five months' decreased.
Main Supply Countries/Regions for Italy 's Knitting Machinery (HS: 8447)Imports
| No. | Countries/Regions | Import Value(thousand USD) | Year-on-year growth (±%) | Market Share | |
| 1 | Japan | 41,799 | 25.11% | 50.50% | |
| 2 | Germany | 22,682 | 10.13% | 27.40% | |
| 3 | Romania | 2,846 | 27.00% | 3.44% | |
| 4 | Switzerland | 2,554 | 94.81% | 3.09% | |
| 5 | Greece | 2,031 | -42.24% | 2.45% | |
| 6 | China | 1,770 | -12.33% | 2.14% | |
| 7 | Croatia | 909 | 856.84% | 1.10% | |
| 8 | Spain | 848 | -6.40% | 1.02% | |
| 9 | The UK | 809 | 21.47% | 0.98% | |
| 10 | France | 781 | 15.70% | 0.94% | |
As the largest supply country for Italy knitting machinery imports, Japan accounted for 50.50% of Italian total imports, and China ranked sixth, accounting for 2.14% of the market share. Italy knitting machinery imports from China in 2011 decreased by 12.33%, 27.41% lower than overall growth of total imports of such products in Italy (15.08%).
Indonesia's Knitting Machinery Import Value Trend, 2009-2011
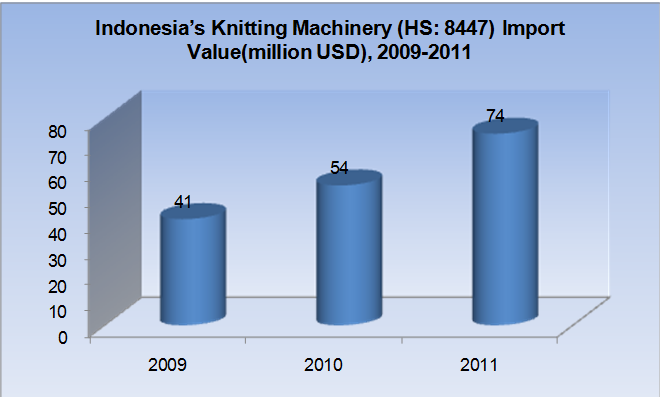
2009-2011, Indonesia knitting machinery imports increased year by year, achieving an increase of 34.00% in 2010 and 35.41% in 2011.
Monthly Trend of Indonesia's Knitting Machinery Import Value, 2011-2012
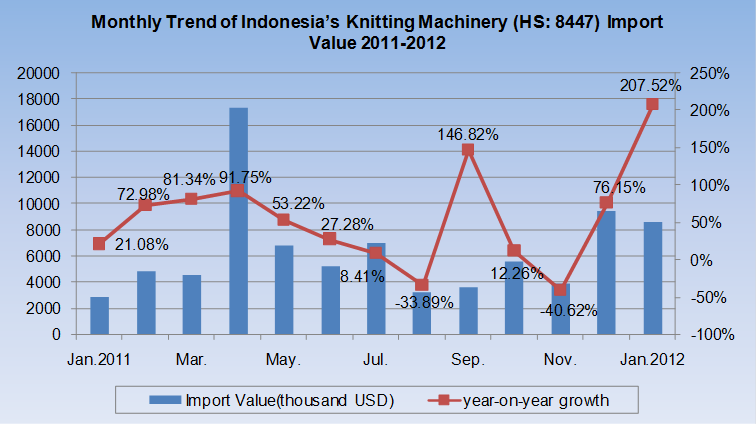
From Jan.2011 to Jan.2012, there were 11 months getting positive year-on-year growth and two getting negative (August and November in 2011).
Main Supply Countries/Regions for Indonesia's Knitting Machinery Imports in 2011
| No. | Countries/Regions | Import Value(thousand USD) | Year-on-year growth (±%) | Market Share |
| 1 | China | 24,956 | 19.49% | 33.83% |
| 2 | Japan | 15,824 | 72.94% | 21.45% |
| 3 | Taiwan | 9,338 | 59.00% | 12.66% |
| 4 | South Korea | 9,040 | 62.47% | 12.25% |
| 5 | Germany | 6,872 | -24.28% | 9.31% |
| 6 | Guatemala | 2,819 | / | 3.82% |
| 7 | Italy | 2,018 | 79.54% | 2.74% |
| 8 | Switzerland | 1,025 | 78.26% | 1.39% |
| 9 | Hong Kong | 469 | 185.98% | 0.64% |
| 10 | Singapore | 469 | 98.73% | 0.64% |
Supply countries for Indonesia's knitting machinery imports were concentrated. In 2011, imports from the top supply countries took an account of 89.50% in its total knitting machinery imports. China is its top supply country with an absolute advantage, accounting for 33.83% of the total imports, followed by Japan and Taiwan, accounting for 21.45% and 12.66% respectively.
Germany's Knitting Machinery Import Value Trend, 2009-2011
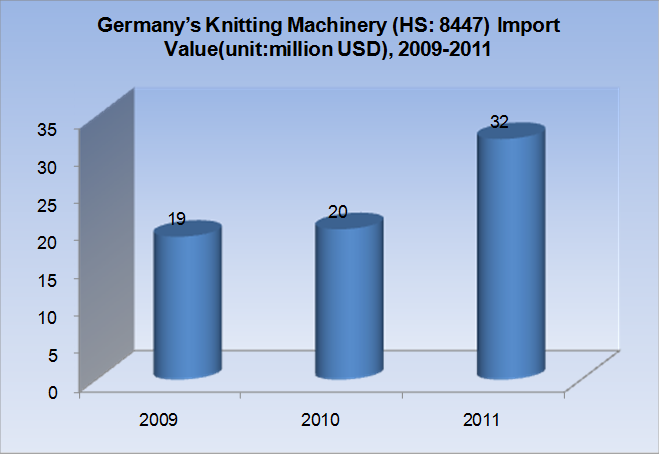
Germany's knitting machinery imports increased year by year from 2009 to 2011, growing by 8.20% in 2010 and 55.28% in 2011.
Monthly Trend of Germany's Knitting Machinery Import Value , 2011-2012
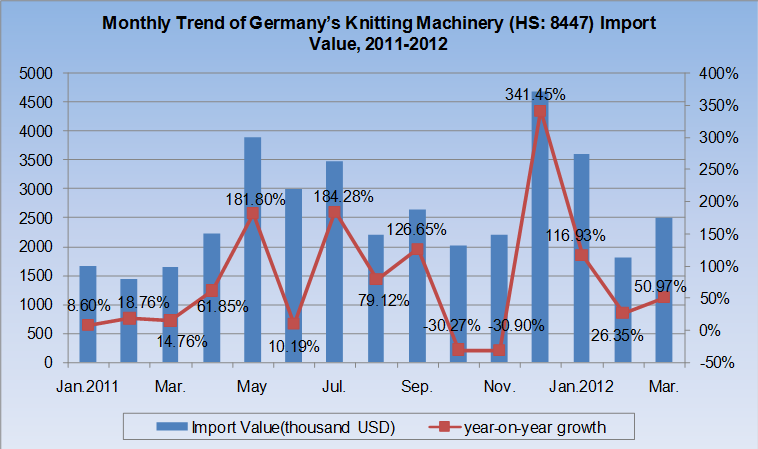
From Jan.2011 to Mar.2012, there were 13 months getting positive year-on-year growth and two getting negative (October and November in 2011).
As can be seen from the figure above, in the first nine months of 2011, year-on-year growth maintained positive, and then in October and November of 2011, the figure decreased significantly. Time went to 2012, and imports year-on-year growth kept positive for three months.
Main Supply Countries/Regions for Germany's Knitting Machinery Imports, 2011
| No. | Countries/Regions | Import Value(thousand USD) | Year-on-year growth (±%) | Market Share |
| 1 | Italy | 5,243 | 51.53% | 16.58% |
| 2 | China | 4,227 | 80.10% | 13.37% |
| 3 | Japan | 4,081 | 172.07% | 12.91% |
| 4 | Taiwan | 3,448 | 37.15% | 10.91% |
| 5 | Switzerland | 3,408 | 2.13% | 10.78% |
| 6 | The USA | 2,447 | 12.20% | 7.74% |
| 7 | Turkey | 1,585 | 322.67% | 5.01% |
| 8 | Thailand | 1,086 | / | 3.43% |
| 9 | Hongkong | 1,059 | / | 3.35% |
| 10 | Austria | 859 | 15.15% | 2.72% |
Italy was the largest supply country for Germany's knitting machinery imports, accounting for 16.58% of the total imports, followed by China, which accounts for 13.37% of the market share. In 2011, Germany's knitting machinery imports from China increased by 80.10%, about 24.82% higher than the overall growth of German imports of such products (55.28%).


