| No. | Countries/Regions | Total (Jan. - Aug.) | Compared with the same period last year | ||
|
|
| Quantity | Amount(Dollars) | Quantity | Amount |
| 1 | America | 10,772,634 | 640,591,217 | -13.8% | -10.5% |
| 2 | Japan | 5,446,642 | 469,863,177 | -4.9% | -6.7% |
| 3 | Indonesia | 3,998,128 | 141,022,629 | 43.6% | 39.4% |
| 4 | Korea | 1,376,814 | 110,324,695 | 2.2% | 9.9% |
| 5 | Russia | 1,596,591 | 96,423,450 | 16.1% | 33.8% |
| 6 | Australia | 747,632 | 55,904,264 | -0.3% | 1.6% |
| 7 | Canada | 810,357 | 51,667,698 | -11.7% | -7.2% |
| 8 | Taiwan | 481,555 | 33,889,222 | 4.8% | 17.1% |
| 9 | Malaysia | 875,932 | 32,722,237 | -26.3% | -33.9% |
| 10 | Ukraine | 635,766 | 29,846,666 | 22.5% | 30.4% |
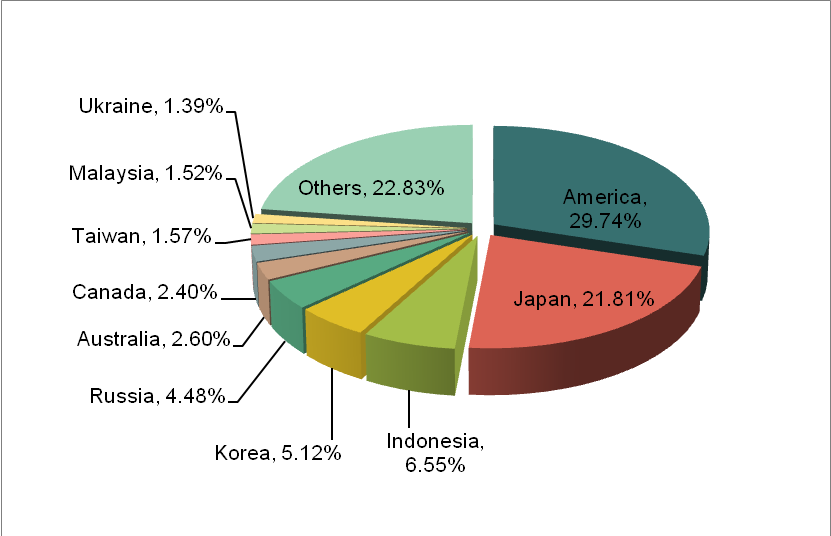
From January to August in 2013, total exports of bicycles and other non-motor bicycles in China are almost 2.154 billion dollars. It decreased by 1.8% year-on-year. The major export countries/regions are America, Japan, Indonesia, Korea, Russia, Australia, Canada, Taiwan, Malaysia, Ukraine, etc. America is the most export market of China in exporting bicycles and other non-motor bicycles. The exports of America account for 29.74% of the total same products exports in China.
Source: Customs Information Network


