2009-2011 Global Injection Machines(HS: 847710) Import Trend Analysis
2009-2011 Global Injection MachinesImport Total Value
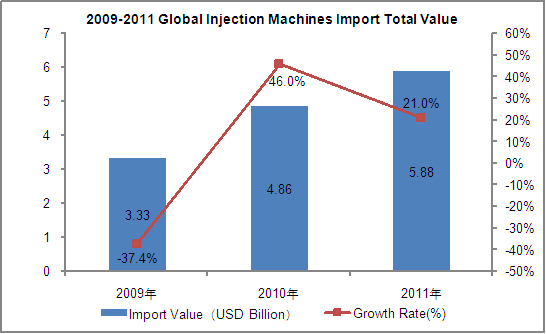
From 2009 to 2011, the import value of global Injection Machines growing year by year, in 2011, the total import value attained 5.88 billion dollars, increased by 2.1%, and the growth was dropped significantly compared to 2010.
2009-2011 Import Value of Main Global Injection MachinesImporters.
| No. | Import Countries/Regions | Import Value USDBillion | Amount in 2011 Compared with 2009 | ||
|
|
| 2009 | 2010 | 2011 |
|
| 1 | China | 575.6 | 997.6 | 913.0 | 58.63% |
| 2 | USA | 218.2 | 377.9 | 560.0 | 156.68% |
| 3 | Thailand | 136.0 | 243.7 | 384.5 | 182.78% |
| 4 | Germany | 183.5 | 193.9 | 310.2 | 69.04% |
| 5 | Brazil | 113.0 | 213.6 | 271.1 | 140.02% |
| 6 | Mexico | 213.3 | 234.2 | 257.9 | 20.89% |
| 7 | Turkey | 62.3 | 137.3 | 203.3 | 226.19% |
| 8 | India | 98.6 | 151.9 | 199.2 | 102.03% |
| 9 | Indonesia | 67.5 | 138.0 | 198.7 | 194.42% |
| 10 | Russian Federation | 66.1 | 112.4 | 163.4 | 147.31% |
| 11 | Hong Kong | 104.0 | 179.2 | 154.5 | 48.50% |
| 12 | Vietnam | 52.2 | 121.3 | 145.1 | 177.78% |
| 13 | Republic of Korea | 85.7 | 120.2 | 128.8 | 50.32% |
| 14 | Malaysia | 93.9 | 98.1 | 116.5 | 23.99% |
| 15 | Italy | 70.6 | 87.9 | 115.2 | 63.12% |
| 16 | Poland | 67.1 | 84.1 | 103.3 | 54.05% |
| 17 | France | 41.4 | 63.2 | 88.4 | 113.28% |
| 18 | Taiwan | 50.4 | 79.7 | 83.8 | 66.08% |
| 19 | Britain | 45.2 | 70.5 | 80.4 | 77.90% |
| 20 | Republic of Czech | 33.2 | 53.9 | 70.7 | 112.75% |
China is one of the largest importers of the Injection Machines, in 2011; the import value achieved 913 million dollars, about accounting for 15.52% of the total import value. From 2009 to 2011, the top 20 countries and regions, except china and Hong Kong, the import value of Injection Machines increased year by year.Comparingwith 2009, the countries which have an increase of more than one times in 2011 are Turkey (increasedby 226.19 %), Indonesia (increasedby194.42%), Thailand (increasedby182.78%), Vietnam (increasedby 177.78 percent), the United States (increasedby156.68%), Russian Federation (increasedby 147.31%), Brazil (increasedby 140.02% ), France (increasedby 113.28%), Czech Republic (increasedby 112.75%) and India (increasedby 102.03%); imports increased by three countries are the United States (increasedabout $ 342 million), China (increasedabout $ 337 million) and Thailand (increasedabout $ 249 million).
2009-2011 The Market Share of Global Injection MachinesImporters
| No. | Import Countries/Regions | Import Value Share | ||
|
|
| 2009 | 2010 | 2011 |
| 1 | China | 17.28% | 20.52% | 15.52% |
| 2 | USA↑ | 6.55% | 7.77% | 9.52% |
| 3 | Thailand↑ | 4.08% | 5.01% | 6.53% |
| 4 | Germany | 5.51% | 3.99% | 5.27% |
| 5 | Brazil↑ | 3.39% | 4.39% | 4.61% |
| 6 | Mexico↓ | 6.41% | 4.82% | 4.38% |
| 7 | Turkey↑ | 1.87% | 2.82% | 3.46% |
| 8 | India↑ | 2.96% | 3.13% | 3.39% |
| 9 | Indonesia↑ | 2.03% | 2.84% | 3.38% |
| 10 | Russian Federation↑ | 1.98% | 2.31% | 2.78% |
| 11 | Hongkong | 3.12% | 3.69% | 2.62% |
| 12 | Vietnam | 1.57% | 2.50% | 2.47% |
| 13 | Republic of Korea↓ | 2.57% | 2.47% | 2.19% |
| 14 | Malaysia↓ | 2.82% | 2.02% | 1.98% |
| 15 | Italy | 2.12% | 1.81% | 1.96% |
| 16 | Poland | 2.01% | 1.73% | 1.76% |
| 17 | France↑ | 1.24% | 1.30% | 1.50% |
| 18 | Taiwan | 1.51% | 1.64% | 1.42% |
| 19 | Britain | 1.36% | 1.45% | 1.37% |
| 20 | Republic of Czech↑ | 1.00% | 1.11% | 1.20% |
Note:“↑”indicates that the index grow continuously from 2009 to 2011;“↓”indicates that the index decline continuously from 2009 to 2011.
From the chart we can see thatthe countries which have continued growth are the United States, Thailand, Brazil, Turkey, India, Indonesia, the Russian Federation, France and the Czech Republic, among them, the United States, Thailand, Turkey increased distinctly, compared to the import value of 2009, increased by2.96%, 2.45% and 1.58%respectively in 2011.


