Annual Export Trends of China's Motor Engine Parts
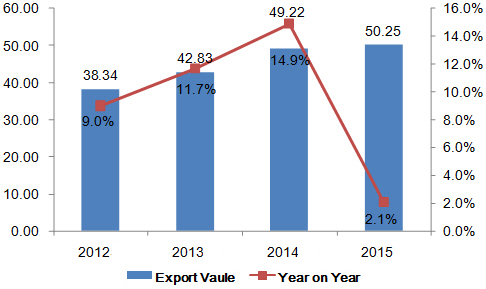
China's motor engine parts export has trended up during the period from 2012 to 2015. The export value in 2015 was USD 5,025,000,000, growing 2.1% on year.
Monthly Export Trends of China's Motor Engine Parts
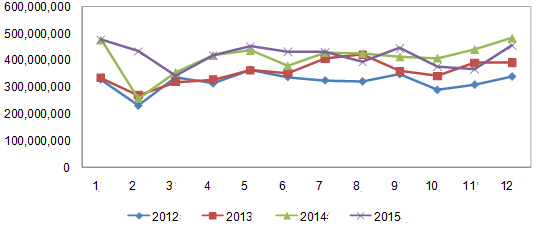
In 2015, China's motor engine parts exports peak was in January and trough was in March
China's Motor Engine Parts Export Volume & Value in 2015
| Month | Volume(kg) | Value(USD) | on Year | |
| Volume | Value | |||
| January | 58,950,233 | 476,984,670 | -6.50% | 0.30% |
| February | 55,025,722 | 434,610,104 | 66.80% | 68.90% |
| March | 43,755,105 | 341,723,764 | -13.60% | -3.60% |
| April | 58,468,667 | 419,491,638 | 0.10% | 0.30% |
| May | 61,414,191 | 452,806,305 | 1.30% | 3.80% |
| June | 55,785,782 | 432,273,245 | 3.70% | 14.10% |
| July | 55,859,313 | 430,012,030 | -4.10% | 0.20% |
| August | 50,007,652 | 393,172,411 | -12.40% | -7.50% |
| September | 58,804,428 | 445,192,764 | 7.40% | 7.70% |
| October | 48,442,719 | 376,532,975 | -7.90% | -7.80% |
| November | 48,399,238 | 366,339,464 | -13.70% | -16.90% |
| December | 60,662,261 | 456,287,516 | 1.90% | -5.60% |
| Total | 655,575,311 | 5,025,426,886 | -0.30% | 2.10% |
From January to December in 2015, China's motor engine parts export value reached USD 5,025,000,000, growing 2.1% on year.
Export Destinations for China's Motor Engine Parts in 2015
| No. | Country/Region | Volume(kg) | Value(USD) | on Year | |
| Volume | Value | ||||
| 1 | United States | 183,094,966 | 1,117,536,828 | 0.60% | 1.20% |
| 2 | Japan | 54,288,785 | 439,302,815 | -5.40% | 1.80% |
| 3 | Germany | 42,176,055 | 396,098,359 | 27.90% | 33.70% |
| 4 | Korea | 30,963,014 | 198,046,128 | 3.90% | 2.70% |
| 5 | Mexico | 14,175,058 | 168,937,831 | 49.80% | 57.40% |
| 6 | Romania | 8,063,592 | 149,833,734 | 1424.80% | 1309.80% |
| 7 | Vietnam | 25,972,406 | 148,214,071 | -7% | -37.50% |
| 8 | India | 23,190,999 | 141,583,240 | -13.70% | -8.80% |
| 9 | Hong Kong | 3,752,860 | 122,936,071 | -2.50% | -6.70% |
| 10 | United Kingdom | 17,072,888 | 118,162,719 | -8.40% | -3.90% |
From January to December in 2015, the top export destinations of China's motor engine parts were the United States, Japan and Germany. In 2015, China exports to Romania grew faster than exports to other markets and the growth was 1309.8% on year.
Export Origins of China's Motor Engine Parts
| No. | District | Volume(kg) | Value(USD) | on Year | |
| Volume | Value | ||||
| 1 | Guangdong | 82,721,982 | 818,197,581 | -0.50% | -16.50% |
| 2 | Jiangsu | 116,991,865 | 757,933,220 | -6% | -2.50% |
| 3 | Tianjin | 52,788,529 | 594,552,565 | 35% | 93.50% |
| 4 | Zhejiang | 59,637,488 | 519,868,650 | 3.10% | 1.80% |
| 5 | Shanghai | 41,110,157 | 469,611,046 | -6.10% | -3.30% |
| 6 | Shandong | 43,616,307 | 315,527,919 | -6.60% | 2% |
| 7 | Chongqing | 26,809,302 | 227,603,593 | 16.20% | 9% |
| 8 | Beijing | 16,440,789 | 213,571,835 | 22.20% | 27.40% |
| 9 | Henan | 60,450,927 | 183,511,764 | 1.90% | 4.80% |
| 10 | Liaoning | 45,787,593 | 170,872,789 | 0.90% | -3.90% |
The top export origins of China's motor engine parts were Guangdong province and Jiangsu province in 2015. Zhejiang province exported USD 818,197,581, making the largest export origins in China. The average export price for motor engine parts from Sichuan was the highest (USD 13.96 per).


