2010-2012 Global Plastic Machinery Import & Export Trends
2010-2012 United States Plastic Machinery Import Value Annual Trends
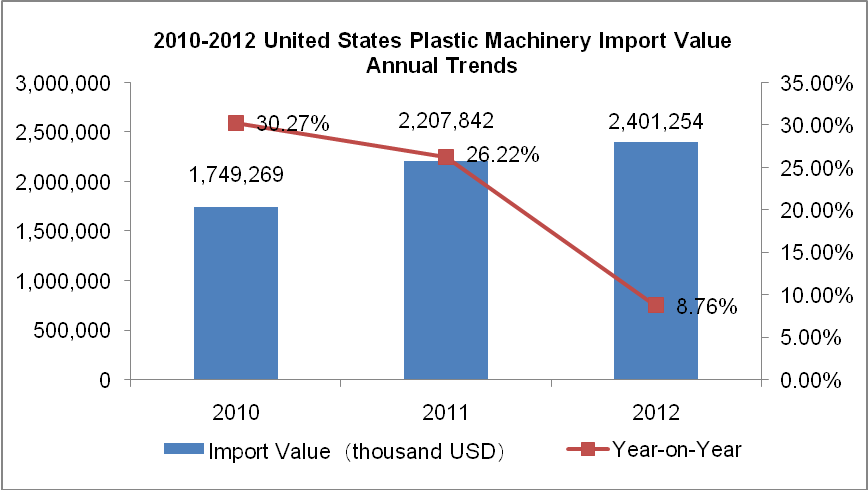
2010-2012 United States importsa mount of plastic machinery increase year after year, the growth rate decreased year by year, which is consistent with the trend of China's annual exports of the product. United States is the world's largest plastics machinery import market except China. But United States is not the largest import market of China's plastics machinery. 2010-2012, United States plastic machinery Import Values were $ 1.749 billion, $ 2.208 billion and $ 2.401 billion, an increase of 30.27%, 26.22% and 8.76%.
2010-2012 United States Plastic Machinery Import Market Analysis
| No. | Country / Region | Import Value((Thousand USD) | 2012 Compared the Same Period 2010 | ||
|
|
| 2010 | 2011 | 2012 |
|
|
| Total | 1, 749, 269 | 2, 207, 842 | 2, 401, 254 | 37.27% |
| 1 | Germany | 411, 311 | 581, 145 | 593, 417 | 44.27% |
| 2 | Canada | 359, 014 | 430, 116 | 468, 068 | 30.38% |
| 3 | Japan | 358, 618 | 352, 297 | 382, 356 | 6.62% |
| 4 | China | 81, 767 | 137, 207 | 187, 918 | 129.82% |
| 5 | Austria | 66, 106 | 130, 522 | 172, 552 | 161.02% |
| 6 | Italy | 112, 430 | 119, 264 | 118, 969 | 5.82% |
| 7 | France | 85, 768 | 111, 855 | 92, 406 | 7.74% |
| 8 | Swiss | 57, 351 | 60, 485 | 53, 452 | -6.80% |
| 9 | Taiwan | 32, 526 | 41, 113 | 47, 913 | 47.31% |
| 10 | Thailand | 24, 779 | 43, 026 | 38, 975 | 57.29% |
2010-2012, Germany is the United States's largest plastics machinery Import sources, with the total amount of $ 593 million and an increase of 44.27% compared the same period 2010. Canada and Japan were ranked second and third. China ranked fourth at a proportion of 7.83%. From 2010 to 2012, in the United States top ten plastic machinery import sources, Austria grew the fastest, with an increased of 161.02% compared the same period in 2010. The second is China, with an increased of 129.82% compared the same period in 2010.
2010-2012 United States Plastic Machinery Import Market Trends Analysis
| No. | Country / Region | Import Value Proportion | ||
|
|
| 2010 | 2011 | 2012 |
| 1 | Germany | 23.51% | 26.32% | 24.71% |
| 2 | Canada | 20.52% | 19.48% | 19.49% |
| 3 | Japan↓ | 20.50% | 15.96% | 15.92% |
| 4 | China↑ | 4.67% | 6.21% | 7.83% |
| 5 | Austria↑ | 3.78% | 5.91% | 7.19% |
| 6 | Italy↓ | 6.43% | 5.40% | 4.95% |
| 7 | France | 4.90% | 5.07% | 3.85% |
| 8 | Swiss↓ | 3.28% | 2.74% | 2.23% |
| 9 | Taiwan↑ | 1.86% | 1.86% | 2.00% |
| 10 | Thailand | 1.42% | 1.95% | 1.62% |
2012, nearly 1/4 of United States Plastic Machinery imports from Germany. China, Austria and Taiwan's market share have increased year by year; Japan, Italy and the Swiss market share declining.
2013 United States Plastic Machinery Import Situation
2013 Jan. - Sep. United States Plastic Machinery Import Market
| Country / Region | Imports Amount(Thousand USD) | compared with the same period | Proportion |
| total | 2, 014, 619 | 19.70% | 100% |
| Germany | 574, 367 | 33.81% | 28.51% |
| Canada | 341, 329 | 7.17% | 16.94% |
| Japan | 296, 700 | 20.39% | 14.73% |
| China | 161, 333 | 17.84% | 8.01% |
| Austria | 124, 436 | 6.80% | 6.18% |
| Italy | 116, 388 | 31.85% | 5.78% |
| France | 86, 307 | 30.90% | 4.28% |
| Swiss | 45, 703 | 28.51% | 2.27% |
| Taiwan | 41, 424 | 11.18% | 2.06% |
| Israel | 32, 782 | 671.52% | 1.63% |
January to September in 2013, Import Value of United States plastic machinery is $ 2.015 billion, with an increase of 19.7%. Germany is the main sources with a proportiob of 28.51%. China ranked fourth with the amount of $ 161 million and a proportiob of 8.01%. The source of Israel grew fastest with a increasing of 671.52%.


