China Packaging & Printing Exports Analysis
Product name corresponding to HS Code description
| HS Code | Product name | Abbreviation |
| 48 | Paper and paperboard; articles of paper pulp, of paper or of paperboard | Paper pulp, paper and paper products |
| 49 | Printed books, newspapers, pictures & other products of the printing industry; manuscripts, typescripts & plans | Products of the printing industry, manuscripts & plans |
| 3215 | Printing ink, writing or drawing ink and other inks, whether or not con centrated or solid | Ink |
| 8443 | Printing machinery used for printing, cylinders and other printing components of heading84.42;other printers Copying machines and facsimile machines, whether or not combined; Part and accessories there of | Printing machinery, printers, copying machines, facsimile machines and part and accessories |
China Packaging & Printing Exports from Jan. to Dec. 2013 (By export value)
| Product name | Unit | Quantity | Value (USD) | Compared to the same period of last year | |
| Quantity | Value | ||||
| Printing machinery, printers, copying machines, facsimile machines and part and accessories | - | 505,270,225 | 25,031,265,281 | 1% | -0.6% |
| Pulp, paper and paper products | kg | 8,661,813,871 | 15,996,328,890 | 14.2% | 16.5% |
| Products of the printing industry, manuscripts & plans | kg | 1,058,433,272 | 3,700,507,390 | -1.4% | 6.5% |
| Ink | kg | 49,012,429 | 301,707,930 | -0.4% | 6.4% |
2013 China Paper pulp, paper and paper products (HS: 48) Exports Analysis
China Paper pulp, paper and paper products Exports, from Jan. to Dec. 2013 (By export value)
| Month | Accumulative total from Jan.-Dec. | Accumulatively compared to the same period of last year | ||
|
| Export Quantity (kg) | Export Value (USD) | Quantity | Value |
| Jan. | 643,995,134 | 1,170,867,738 | 22% | 37.4% |
| Feb. | 487,439,523 | 849,491,330 | -1.3% | 23.9% |
| Mar. | 717,584,501 | 1,144,568,610 | 11.8% | 12.7% |
| Apr. | 695,616,564 | 1,229,442,012 | 11.7% | 10.6% |
| May | 767,887,523 | 1,340,455,304 | 9.5% | 1.3% |
| Jun. | 734,276,573 | 1,312,217,750 | 10.6% | 5.3% |
| Jul. | 778,472,481 | 1,416,120,617 | 22.7% | 10.4% |
| Aug. | 779,311,792 | 1,453,364,819 | 16.2% | 14.3% |
| Sep. | 763,763,580 | 1,455,319,342 | 7.3% | 9.3% |
| Oct. | 753,059,434 | 1,509,810,917 | 20.6% | 26.4% |
| Nov. | 767,129,577 | 1,531,987,020 | 21.2% | 36% |
| Dec. | 773,277,189 | 1,582,683,431 | 17.6% | 23.3% |
| Accumulative total from Jan.-Dec. | 8,661,813,871 | 15,996,328,890 | 14.2% | 16.5% |
From Jan. to Dec. 2013, our country's paper pulp, paper and paper products export quantity amounted to 8.662 million tons, with an increase of 14.2% YOY, and the export value amounted to 15.996 billion US dollars, with an increase of 16.5% YOY.
1.1.2. China Paper pulp, paper and paper products Export Volume and Value and Major Export Countries/Regions, from Jan. to Dec. 2013 (By export value)
| No. | Country/Region | Accumulative total from Jan.-Dec. | Accumulatively compared to the same period of last year | ||
|
|
| Quantity (kg) | Value (USD) | Quantity | Value |
| 1 | USA | 928,102,276 | 2,423,000,206 | 6.8% | 6.3% |
| 2 | Hong Kong | 733,639,397 | 1,476,678,749 | -7.2% | 17.3% |
| 3 | Japan | 773,361,695 | 1,253,958,692 | -8.5% | -4.6% |
| 4 | Australia | 363,856,645 | 651,443,476 | -3.1% | 6.2% |
| 5 | Malaysia | 302,267,840 | 569,611,756 | 34.7% | 39.3% |
| 6 | United Kingdom | 179,186,356 | 521,295,980 | 20.4% | 11.6% |
| 7 | India | 324,809,984 | 427,705,610 | 37.2% | 37.1% |
| 8 | Singapore | 133,982,430 | 403,450,674 | 8.7% | 57.6% |
| 9 | Republic of Korea | 276,744,359 | 397,685,674 | 24.9% | 18.5% |
| 10 | Iran | 223,093,929 | 393,871,861 | 61.1% | 106.6% |
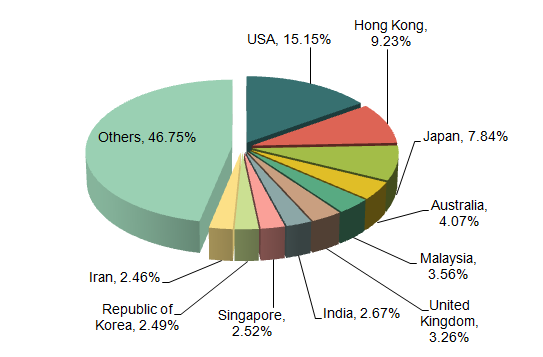
As can be seen from the export data of Jan.-Dec. 2013, China paper pulp, paper and paper products major export countries were USA, Hong Kong, Japan, Australia, Malaysia, United Kingdom, India, Singapore, Republic of Korea and Iran and so on. USA was the main export market of our country's paper pulp, paper and paper products, and the export value to USA in 2013 accounted for 15.15% of the total export value of the products. Among the top ten paper pulp, paper and paper products export markets in 2013, the export value to Iran increased by 106.6% YOY, for the largest increase in value.
China Paper pulp, paper and paper products Export Enterprises Distribution, from Jan. to Dec. 2013 (By export value)
| No. | Region | Accumulative total from Jan.-Dec. | Accumulatively compared to the same period of last year | ||
|
|
| Quantity (kg) | Value (USD) | Quantity | Value |
| 1 | Guangdong | 2,256,097,367 | 6,100,795,998 | 23.5% | 38.9% |
| 2 | Zhejiang | 1,492,262,043 | 2,779,808,091 | 21.5% | 17.5% |
| 3 | Jiangsu | 1,947,055,502 | 2,389,085,481 | 0.1% | -3.2% |
| 4 | Shandong | 1,424,899,593 | 1,439,745,915 | 16.5% | 11.1% |
| 5 | Shanghai | 271,549,207 | 724,158,997 | 2.6% | 1.2% |
| 6 | Fujian | 317,336,208 | 663,240,432 | 1.2% | -4.2% |
| 7 | Liaoning | 80,076,262 | 259,240,739 | 16.7% | 15.7% |
| 8 | Hainan | 291,072,057 | 251,149,450 | 63.5% | 63.9% |
| 9 | Anhui | 78,729,694 | 210,073,058 | 16.7% | -3.7% |
| 10 | Henan | 138,168,094 | 159,804,637 | 20.8% | 17.6% |
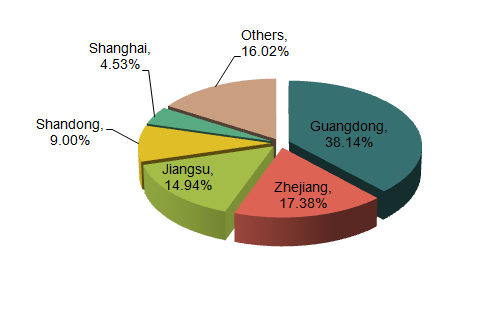
As can be seen from the export data of Jan.-Dec. 2013, China paper pulp, paper and paper products original places of exported goods are Guangdong, Zhejiang and Jiangsu, among which, the export value of Guangdong accounted for 38.14% of the total export value of our country.
2013 China Products of the printing industry, manuscripts & plans (HS: 49) Exports Analysis
China Products of the printing industry, manuscripts & plans Exports, from Jan. to Dec. 2013 (By export value)
| Month | Accumulative total from Jan.-Dec. | Accumulatively compared to the same period of last year | ||
|
| Export Quantity (kg) | Export Value (USD) | Quantity | Value |
| Jan. | 73,958,290 | 258,364,418 | 5.4% | 17.7% |
| Feb. | 55,826,857 | 200,587,847 | 4.9% | 27.5% |
| Mar. | 69,886,792 | 245,860,479 | -8.7% | 6.8% |
| Apr. | 80,422,719 | 280,437,231 | 0.4% | 8.6% |
| May | 84,548,981 | 317,179,282 | 2.1% | 17.4% |
| Jun. | 93,799,208 | 308,654,128 | 2.2% | 3.7% |
| Jul. | 114,365,110 | 364,525,906 | 5.5% | 5.8% |
| Aug. | 131,361,078 | 437,553,079 | 0.4% | 7.9% |
| Sep. | 108,762,290 | 360,615,571 | -11.1% | -3.6% |
| Oct. | 89,394,406 | 321,818,190 | -5.7% | 3.4% |
| Nov. | 75,644,302 | 288,596,866 | 8.6% | 12.6% |
| Dec. | 80,463,239 | 316,314,393 | -13.4% | -9.4% |
| Accumulative total from Jan.-Dec. | 1,058,433,272 | 3,700,507,390 | -1.4% | 6.5% |
From Jan. to Dec. 2013, our country's products of the printing industry, manuscripts & plans export quantity amounted to 1.0584 million tons, with a decrease of 1.4% YOY, and the export value amounted to 3.701 billion US dollars, with an increase of 6.5% YOY.
China Products of the printing industry, manuscripts & plans Export Volume and Value and Major Export Countries/Regions, from Jan. to Dec. 2013 (By export value)
| No. | Country/Region | Accumulative total from Jan.-Dec. | Accumulatively compared to the same period of last year | ||
|
|
| Quantity (kg) | Value (USD) | Quantity | Value |
| 1 | USA | 317,367,046 | 1,065,876,476 | 9.2% | 12.9% |
| 2 | Hong Kong | 266,696,519 | 778,385,555 | -13.2% | 0.2% |
| 3 | United Kingdom | 113,424,086 | 336,088,930 | -5.7% | -1.5% |
| 4 | Japan | 21,323,052 | 123,257,881 | -15.7% | -10% |
| 5 | Germany | 38,087,719 | 119,852,537 | -7.5% | 2.5% |
| 6 | Australia | 37,631,859 | 116,338,621 | 10.3% | 7.6% |
| 7 | France | 27,512,337 | 95,409,738 | -0.8% | 2.1% |
| 8 | Canada | 21,405,460 | 71,354,613 | 14.5% | 23.3% |
| 9 | Russian Federation | 19,781,020 | 69,461,440 | -8.2% | -6.9% |
| 10 | Netherlands | 15,406,900 | 60,775,313 | -15% | -3.2% |
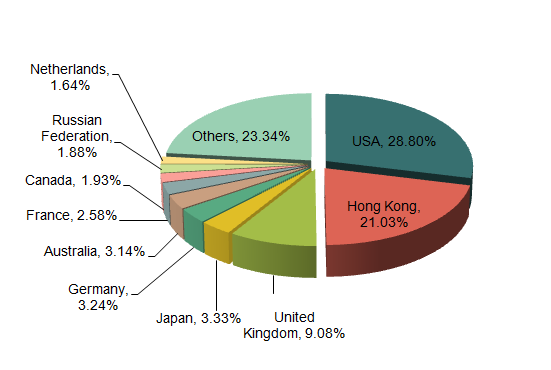
As can be seen from the export data of Jan.-Dec. 2013, China products of the printing industry, manuscripts & plans major export markets were USA, Hong Kong, United Kingdom, Japan, Germany, Australia, France, Canada, the Russian Federation and the Netherlands and so on. USA and Hong Kong were the main export markets of our country's products of the printing industry, manuscripts & plans, and the export value to USA and Hong Kong in 2013 accounted for 28.8% and 21.03% of the total export value of the products.
China Products of the printing industry, manuscripts & plans Export Enterprises Distribution, from Jan. to Dec. 2013 (By export value)
| No. | Region | Accumulative total from Jan.-Dec. | Accumulatively compared to the same period of last year | ||
|
|
| Quantity (kg) | Value (USD) | Quantity | Value |
| 1 | Guangdong | 794,186,194 | 2,592,123,882 | -4.3% | 8% |
| 2 | Zhejiang | 109,314,753 | 357,311,439 | 23.3% | 24.5% |
| 3 | Jiangsu | 32,667,194 | 180,902,534 | -2.3% | -7.1% |
| 4 | Shanghai | 47,804,028 | 172,244,702 | -3.5% | -2.3% |
| 5 | Fujian | 33,166,526 | 134,103,804 | 17.1% | 1.4% |
| 6 | Beijing | 13,947,855 | 90,490,976 | -9.1% | -8.8% |
| 7 | Anhui | 3,765,558 | 38,021,231 | 6.8% | 12.1% |
| 8 | Jiangxi | 3,435,697 | 19,556,915 | -12.8% | -14.3% |
| 9 | Shandong | 5,079,183 | 19,204,252 | 4.2% | 7.2% |
| 10 | Chongqing | 1,708,118 | 15,473,969 | -12.7% | -39.1% |
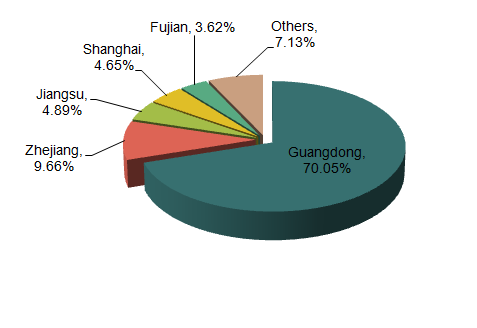
As can be seen from the export data of Jan.-Dec. 2013, China products of the printing industry, manuscripts & plans original places of exported goods are Guangdong, Zhejiang and Jiangsu, among which, the export value of Guangdong accounted for 70.05% of the total export value of our country, and the original places of exported goods are highly concentrated.
2013 China Ink (HS: 3215) Exports Analysis
China Ink Exports, from Jan. to Dec. 2013 (By export value)
| Month | Accumulative total from Jan.-Dec. | Accumulatively compared to the same period of last year | ||
|
| Export Quantity (kg) | Export Value (USD) | Quantity | Value |
| Jan. | 4,187,073 | 25,908,741 | 5.1% | 14% |
| Feb. | 3,119,624 | 19,980,004 | -3.3% | 7.6% |
| Mar. | 4,527,344 | 27,288,624 | -2.9% | 3.3% |
| Apr. | 4,093,877 | 24,562,464 | 5.3% | 17.5% |
| May | 4,326,143 | 24,996,753 | -1.1% | -0.6% |
| Jun. | 3,922,958 | 24,807,746 | -6.9% | 6.9% |
| Jul. | 4,472,288 | 27,396,953 | 11.3% | 26.9% |
| Aug. | 3,795,004 | 23,206,781 | -15.6% | -10.9% |
| Sep. | 3,930,266 | 24,466,822 | -4.1% | 2.1% |
| Oct. | 3,945,109 | 22,807,479 | 10% | 2.4% |
| Nov. | 4,481,327 | 28,418,770 | 2.3% | 13.2% |
| Dec. | 4,211,416 | 27,866,793 | -2.2% | 1.5% |
| Accumulative total from Jan.-Dec. | 49,012,429 | 301,707,930 | -0.4% | 6.4% |
From Jan. to Dec. 2013, our country's ink export quantity amounted to 49,000 tons, with a slight decrease of 0.4% YOY, and the export value amounted to 302 million US dollars, with an increase of 6.4% YOY.
China Ink Export Volume and Value and Major Export Countries/Regions, from Jan. to Dec. 2013 (By export value)
| No. | Country/Region | Accumulative total from Jan.-Dec. | Accumulatively compared to the same period of last year | ||
|
|
| Quantity (kg) | Value (USD) | Quantity | Value |
| 1 | USA | 2,077,373 | 29,793,770 | 10% | 68.6% |
| 2 | Hong Kong | 3,661,696 | 26,119,076 | -45.8% | -47.8% |
| 3 | Indonesia | 3,997,059 | 21,028,186 | 20.7% | 42.6% |
| 4 | Japan | 1,972,166 | 19,779,827 | 5% | 19.7% |
| 5 | India | 2,815,792 | 15,116,185 | 9.8% | 20.7% |
| 6 | Viet Nam | 2,645,671 | 13,299,834 | 3% | 38.7% |
| 7 | Malaysia | 2,267,506 | 12,177,404 | 15.5% | 49.4% |
| 8 | Thailand | 2,027,930 | 11,027,227 | 1.2% | 9.1% |
| 9 | Netherlands | 543,741 | 10,175,446 | 44.5% | 55% |
| 10 | Taiwan | 2,004,405 | 9,344,270 | 15% | 20.1% |
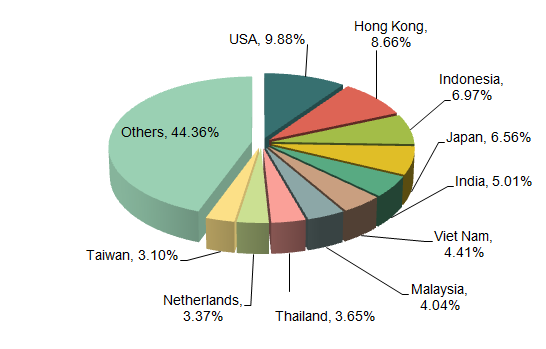
As can be seen from the export data of Jan.-Dec. 2013, China ink major export markets were USA, Hong Kong, Indonesia, Japan, India, Vietnam, Malaysia, Thailand, the Netherlands and Taiwan and so on. USA was the main export market of our country's ink, and the export value to USA in 2013 accounted for 9.88% of the total export value of the products. Our country's ink export markets are relatively decentralized.
China Ink Export Enterprises Distribution, from Jan. to Dec. 2013 (By export value)
| No. | Region | Accumulative total from Jan.-Dec. | Accumulatively compared to the same period of last year | ||
|
|
| Quantity (kg) | Value (USD) | Quantity | Value |
| 1 | Guangdong | 16,461,338 | 132,306,659 | -10.4% | 11.1% |
| 2 | Shanghai | 7,332,788 | 53,291,905 | -0.8% | -0.4% |
| 3 | Zhejiang | 6,190,604 | 29,099,748 | 13.8% | 10.3% |
| 4 | Jiangsu | 6,228,935 | 27,884,000 | 10.7% | -1.5% |
| 5 | Tianjin | 4,096,249 | 16,647,179 | -9.6% | -11.4% |
| 6 | Shandong | 2,603,726 | 12,572,447 | 21.4% | 17.2% |
| 7 | Fujian | 1,453,944 | 6,678,860 | 7.1% | 8.6% |
| 8 | Jiangxi | 1,018,205 | 4,519,021 | 25.2% | 26.3% |
| 9 | Liaoning | 821,602 | 3,952,998 | 36.7% | 31% |
| 10 | Beijing | 908,563 | 3,749,401 | -18% | -3.9% |
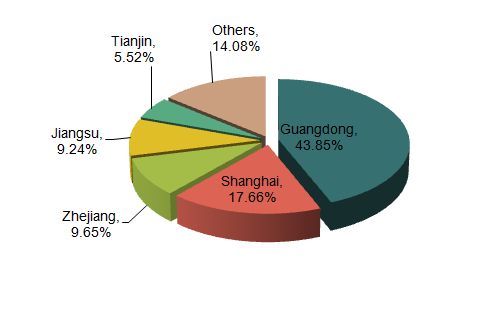
As can be seen from the export data of Jan.-Dec. 2013, China ink original places of exported goods are Guangdong, Shanghai and Zhejiang, among which, the export value of Guangdong accounted for 43.85% of the total export value of our country.
2013 China Printing machinery, printers, copying machines, facsimile machines and part and accessories (HS: 8443) Exports Analysis
China Printing machinery, printers, copying machines, facsimile machines and part and accessories Exports, from Jan. to Dec. 2013 (By export value)
| Month | Accumulative total from Jan.-Dec. | Accumulatively compared to the same period of last year | ||
|
| Export Quantity (-) | Export Value (USD) | Quantity | Value |
| Jan. | 41,192,218 | 1,990,470,470 | 9.3% | 5.2% |
| Feb. | 32,921,929 | 1,660,835,886 | -15.3% | -16.5% |
| Mar. | 41,273,106 | 2,161,654,463 | -6.5% | -4.6% |
| Apr. | 41,159,085 | 2,016,466,290 | -0.8% | -3.1% |
| May | 45,752,218 | 2,202,451,206 | 2.8% | 0.4% |
| Jun. | 40,202,014 | 2,059,754,024 | -5.2% | -4% |
| Jul. | 43,530,933 | 2,139,854,111 | 6.9% | 9.6% |
| Aug. | 43,987,757 | 2,172,121,049 | 1.2% | 0.3% |
| Sep. | 42,681,307 | 2,089,886,031 | -2.2% | -4.2% |
| Oct. | 43,918,749 | 2,154,591,596 | 9.8% | 7.1% |
| Nov. | 44,762,130 | 2,193,384,166 | 19.1% | 13.8% |
| Dec. | 43,888,779 | 2,189,795,989 | -4.3% | -7.7% |
| Accumulative total from Jan.-Dec. | 505,270,225 | 25,031,265,281 | 1% | -0.6% |
From Jan. to Dec. 2013, our country's printing machinery, printers, copying machines, facsimile machines and part and accessories export quantity amounted to 505 million, with an increase of 1% YOY, and the export value amounted to 25.031 billion US dollars, with a decrease of 0.6% YOY.
China Printing machinery, printers, copying machines, facsimile machines and part and accessories Export Volume and Value and Major Export Countries/Regions, from Jan. to Dec. 2013 (By export value)
| No. | Country/Region | Accumulative total from Jan.-Dec. | Accumulatively compared to the same period of last year | ||
|
|
| Quantity (-) | Value (USD) | Quantity | Value |
| 1 | USA | 105,052,839 | 5,915,346,873 | -6.1% | -6.4% |
| 2 | Hong Kong | 94,951,147 | 4,592,937,625 | -3.4% | 5.8% |
| 3 | Netherlands | 61,182,101 | 3,147,932,042 | -1.3% | -3.6% |
| 4 | Japan | 66,086,285 | 2,809,153,125 | -1.6% | -4.9% |
| 5 | Germany | 22,904,058 | 1,803,388,313 | 7.5% | 5.4% |
| 6 | Republic of Korea | 8,994,399 | 580,835,588 | 3.5% | 7.7% |
| 7 | Singapore | 10,554,488 | 577,302,426 | -4% | 0% |
| 8 | Australia | 8,417,676 | 526,160,957 | 6.7% | 0.4% |
| 9 | France | 6,445,375 | 429,374,037 | -9.4% | -11% |
| 10 | India | 5,352,923 | 361,696,931 | 17.9% | 9.3% |
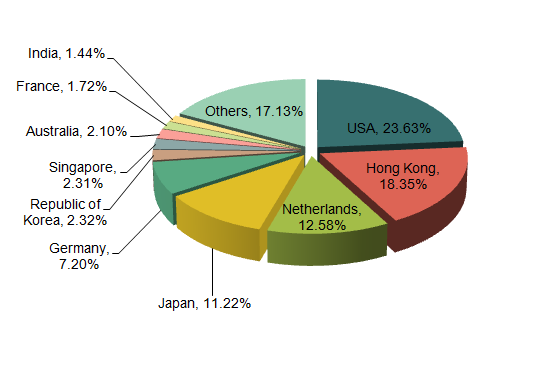
As can be seen from the export data of Jan.-Dec. 2013, China printing machinery, printers, copying machines, facsimile machines and part and accessories major export markets were USA, Hong Kong, the Netherlands, Japan, Germany, Republic of Korea, Singapore, Australia, France and India and so on. USA, Hong Kong and the Netherlands were the main export markets of our country's printing machinery, printers, copying machines, facsimile machines and part and accessories, and the export value to the three markets in 2013 accounted for 23.63%, 18.35% and 12.58% of the total export value of the products respectively.
China Printing machinery, printers, copying machines, facsimile machines and part and accessories Export Enterprises Distribution, from Jan. to Dec. 2013 (By export value)
| No. | Region | Accumulative total from Jan.-Dec. | Accumulatively compared to the same period of last year | ||
|
|
| Quantity (-) | Value (USD) | Quantity | Value |
| 1 | Guangdong | 314,625,471 | 15,128,735,559 | 1% | -6.6% |
| 2 | Jiangsu | 54,414,140 | 3,375,746,270 | -5.9% | -3.5% |
| 3 | Chongqing | 18,699,270 | 2,259,822,987 | 157.1% | 169.5% |
| 4 | Shandong | 35,355,184 | 1,361,889,009 | 1.2% | -10.4% |
| 5 | Shanghai | 17,788,687 | 1,245,116,997 | -3.9% | -5.7% |
| 6 | Liaoning | 29,939,680 | 873,269,486 | -9.6% | -4.1% |
| 7 | Tianjin | 6,738,515 | 185,876,819 | -2.1% | -25.4% |
| 8 | Fujian | 10,641,170 | 172,914,938 | -28.9% | -22.5% |
| 9 | Zhejiang | 6,370,326 | 134,803,684 | 2.7% | -8.2% |
| 10 | Jiangxi | 4,693,717 | 111,784,693 | 33.1% | 22.4% |
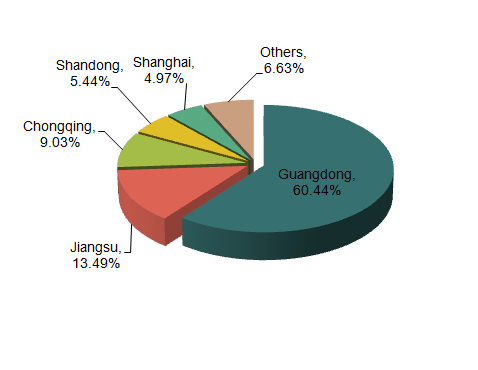
As can be seen from the export data of Jan.-Dec. 2013, China printing machinery, printers, copying machines, facsimile machines and part and accessories original places of exported goods are Guangdong, Jiangsu and Chongqing, among which, the export value of Guangdong accounted for 60.44% of the total export value of our country.
Source: Customs Information Network


