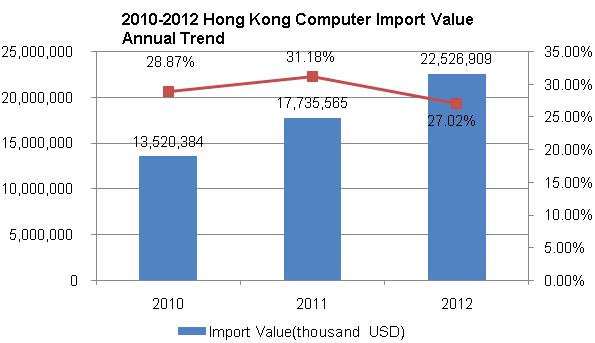
2010-2012 Hong Kong Computer Import Value Annual Trend

Hong Kong's import value of computer increased year by year from 2010 to 2012, the import value of the three years all increased by more than 25% year on year, which were higher than global import value growth by 25.38%, 11.65% and 4.77% respectively.
2010-2012 Hong Kong Computer Main Import Market Trend Analysis
| No. | Countries/Regions | Import Value (USD) | Growth Compared 2012 to 2010 | ||
| 2010 | 2011 | 2012 | |||
| 1 | China↑ | 8,681,703 | 13,083,141 | 16,997,829 | 95.79% |
| 2 | Thailand | 1,888,295 | 1,687,196 | 1,868,993 | -1.02% |
| 3 | Singapore↑ | 430,129 | 564,606 | 784,373 | 82.36% |
| 4 | USA↑ | 458,031 | 485,777 | 645,190 | 40.86% |
| 5 | Malaysia | 630,514 | 576,642 | 635,282 | 0.76% |
| 6 | Philippines↑ | 351,502 | 381,959 | 528,638 | 50.39% |
| 7 | Taiwan↑ | 110,165 | 182,243 | 209,863 | 90.50% |
| 8 | Japan | 212,934 | 152,458 | 156,450 | -26.53% |
| 9 | Mexico | 113,907 | 146,579 | 142,115 | 24.76% |
| 10 | Netherlands↑ | 25,695 | 53,457 | 107,089 | 316.77% |
| 11 | Hungary↑ | 21,974 | 66,987 | 85,706 | 290.03% |
| 12 | South Korea↓ | 318,320 | 172,913 | 71,832 | -77.43% |
| 13 | Vietnam | 4,467 | 4,448 | 62,859 | 1307.19% |
| 14 | Ireland | 139,556 | 43,191 | 50,623 | -63.73% |
| 15 | Australia↑ | 16,709 | 18,310 | 40,508 | 142.43% |
| 16 | UK↑ | 15,784 | 22,184 | 37,464 | 137.35% |
| 17 | Germany↓ | 39,034 | 32,192 | 31,717 | -18.75% |
| 18 | Canada↓ | 23,541 | 19,858 | 18,744 | -20.38% |
| 19 | France↑ | 4,725 | 10,108 | 11,062 | 134.12% |
| 20 | Israel↑ | 3,293 | 5,071 | 7,667 | 132.83% |
Notice: “↑” indicate the continued rise during 2010-2012, “↓” indicate the continued decline during 2010--2012
China is Hong Kong's biggest computer import source country from 2010 to 2012. Hong Kong's import value of computer from China amounted to 17 billion US dollars in 2012.
Among the above twenty import source countries, Hong Kong's import value from Netherlands, Hungary, Vietnam, Australia, UK, France and Israel in 2012 all increased more than 100% compared to the same period of 2010, and Hong Kong's import value from Vietnam in 2012 increased sharply by 1307.19% compared to the same period of 2010.
From 2010 to 2012, Among Hong Kong's top twenty import markets, Hong Kong's import value from China, Singapore, USA, Philippines, Taiwan, Netherlands, Hungary, Australia, UK, France and Israel increased year by year, while import value from South Korea, Germany and Canada decreased year by year.
2010-2012 Hong Kong Computer Main Import Market Share Trend Analysis
| No. | Countries/Regions | Import Value Percentage | ||
| 2010 | 2011 | 2012 | ||
| 1 | China↑ | 64.21% | 73.77% | 75.46% |
| 2 | Thailand↓ | 13.97% | 9.51% | 8.30% |
| 3 | Singapore↑ | 3.18% | 3.18% | 3.48% |
| 4 | USA | 3.39% | 2.74% | 2.86% |
| 5 | Malaysia↓ | 4.66% | 3.25% | 2.82% |
| 6 | Philippines | 2.60% | 2.15% | 2.35% |
| 7 | Taiwan | 0.81% | 1.03% | 0.93% |
| 8 | Japan↓ | 1.57% | 0.86% | 0.69% |
| 9 | Mexico↓ | 0.84% | 0.83% | 0.63% |
| 10 | Netherlands↑ | 0.19% | 0.30% | 0.48% |
| 11 | Hungary↑ | 0.16% | 0.38% | 0.38% |
| 12 | South Korea↓ | 2.35% | 0.97% | 0.32% |
| 13 | Vietnam | 0.03% | 0.03% | 0.28% |
| 14 | Ireland↓ | 1.03% | 0.24% | 0.22% |
| 15 | Australia | 0.12% | 0.10% | 0.18% |
| 16 | UK↑ | 0.12% | 0.13% | 0.17% |
| 17 | Germany↓ | 0.29% | 0.18% | 0.14% |
| 18 | Canada↓ | 0.17% | 0.11% | 0.08% |
| 19 | France | 0.03% | 0.06% | 0.05% |
| 20 | Israel↑ | 0.02% | 0.03% | 0.03% |
Notice: “↑” indicate the continued rise during 2010-2012, “↓” indicate the continued decline during 2010--2012
China is Hong Kong's main import source country, and China's computer occupied more than 3/4 Hong Kong's market share in 2012.
From 2010 to 2012, Among Hong Kong's top twenty import markets, the import value percentage of China, Israel, UK, Hungary, Netherlands and Singapore continued to increase, and that of Thailand, Malaysia, Japan, South Korea, Ireland, Canada, Germany and Mexico continued to decrease.
Source: UN Comtrade


