China Kitchenware of Plastics (HS: 3924) Major Export Markets in 2014
| No. | Country/Region | Jan. - Dec. Total | Total YOY | ||
| Volume (Kg) | Value (USD) | Volume | Value | ||
| 1 | USA | 619,729,423 | 2,330,697,011 | 12.4% | 20% |
| 2 | Japan | 83,963,704 | 372,132,083 | 1.3% | 6.3% |
| 3 | United Kingdom | 57,928,706 | 251,344,367 | 20.5% | 28.2% |
| 4 | Hong Kong | 68,256,950 | 240,815,056 | 18.7% | 32.5% |
| 5 | Australia | 62,542,185 | 235,662,701 | 20% | 27.1% |
| 6 | Germany | 39,604,784 | 209,196,010 | 18.6% | 34.6% |
| 7 | Iran | 21,175,242 | 174,428,629 | 300.2% | 239.2% |
| 8 | Canada | 43,878,547 | 172,344,431 | 12.6% | 21.3% |
| 9 | United Arab Emirates | 32,129,385 | 160,149,745 | 60.4% | 124.4% |
| 10 | Netherlands | 31,125,226 | 157,865,172 | 27.8% | 49.7% |
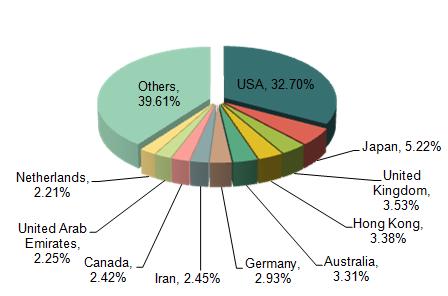
From Jan. to Dec. 2014, China kitchenware of plastics major export markets are the United States, Japan, the United Kingdom, Hong Kong, Australia, Germany, Iran, Canada, the United Arab Emirates and the Netherlands and etc. The United States is the main export market of China kitchenware of plastics, and the export value to the United States accounted for 32.7% of the total export value of the products. From Jan. to Dec. 2014, among the top ten large export markets of China kitchenware of plastics, the export value to Iran increased the fastest, an increase of 239.2% YOY.
China Toilet Paper in Rolls or Sheets of a Width Exceeding 36cm (HS: 4803) Major Export Markets in 2014
| No. | Country/Region | Jan. - Dec. Total | Total YOY | ||
| Volume (Kg) | Value (USD) | Volume | Value | ||
| 1 | Australia | 63,049,641 | 72,076,005 | 37.6% | 38.3% |
| 2 | USA | 20,142,700 | 38,125,461 | -13.8% | -17.1% |
| 3 | Taiwan | 20,366,368 | 24,737,104 | -15.9% | -11.9% |
| 4 | United Kingdom | 17,133,446 | 21,765,230 | 34% | 37.1% |
| 5 | Iran | 9,813,546 | 21,365,242 | -61.8% | -39.2% |
| 6 | Croatia | 14,185,715 | 15,579,501 | 157% | 157.6% |
| 7 | Malaysia | 4,146,783 | 11,334,911 | 48% | 146.6% |
| 8 | Indonesia | 4,221,078 | 9,744,034 | 112.6% | 62.9% |
| 9 | Canada | 6,956,134 | 9,381,003 | 80.5% | 56.9% |
| 10 | United Arab Emirates | 4,795,734 | 8,450,323 | -22.7% | -4.2% |
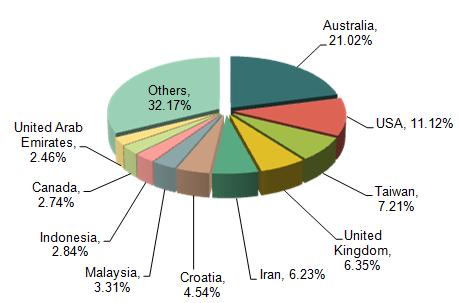
The export value of China toilet paper in rolls or sheets of a width exceeding 36cm in 2014 amounted to 343 million US dollars, an increase of 20.5% YOY. Major export markets are Australia, the United States, Taiwan, the United Kingdom, Iran, Croatia, Malaysia, Indonesia, Canada and the United Arab Emirates and etc.
Australia and the United States are the main export markets of China toilet paper in rolls or sheets of a width exceeding 36cm, and the export value to Australia and the United States accounted for 21.02% and 11.12% separately of the total export value of the products. From Jan. to Dec. 2014, among the top ten large export markets of China toilet paper in rolls or sheets of a width exceeding 36cm, the export value to Croatia increased the fastest, an increase of 157.6% YOY.
China Toilet Paper in Rolls or Sheets of a Width Not Exceeding 36cm (HS: 4818) Major Export Markets in 2014
| No. | Country/Region | Jan. - Dec. Total | Total YOY | ||
| Volume (Kg) | Value (USD) | Volume | Value | ||
| 1 | USA | 153,473,936 | 397,322,078 | 11.1% | 34.5% |
| 2 | Japan | 143,004,419 | 280,830,310 | 18.7% | 20.1% |
| 3 | Hong Kong | 128,156,294 | 223,758,639 | 4.7% | 9.5% |
| 4 | Iran | 11,495,465 | 91,907,561 | 421.8% | 278.2% |
| 5 | Australia | 30,746,334 | 83,923,197 | 12.7% | 28.5% |
| 6 | Singapore | 10,807,445 | 61,448,588 | 38.8% | 66% |
| 7 | Malaysia | 6,311,423 | 46,162,263 | 17% | 41.2% |
| 8 | Russian Federation | 7,380,499 | 41,681,879 | 65.3% | 296.7% |
| 9 | United Kingdom | 12,340,695 | 37,519,060 | 36.7% | 39.5% |
| 10 | United Arab Emirates | 6,095,079 | 37,139,842 | 241% | 323.7% |
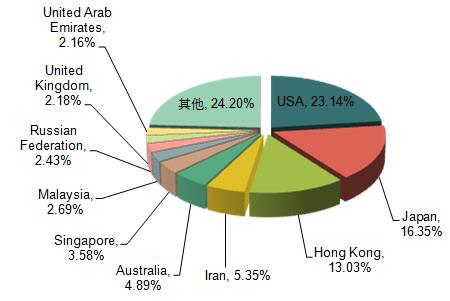
The export value of China toilet paper in rolls or sheets of a width not exceeding 36cm in 2014 amounted to 1717 million US dollars, an increase of 43.9% YOY. Major export markets are the United States, Japan, Hong Kong, Iran, Australia, Singapore, Malaysia, the Russian Federation, the United Kingdom and the United Arab Emirates and etc.
The export value to the United States accounted for 23.14% of the total export value of the products in 2014, followed by Japan, accounting for 16.35%, and Hong Kong ranked the third, accounting for 13.03%.
China Umbrellas and Sun Umbrellas (HS: 6601) Major Export Markets in 2014
| No. | Country/Region | Jan. - Dec. Total | Total YOY | ||
| Volume (Kg) | Value (USD) | Volume | Value | ||
| 1 | USA | 73,014,489 | 402,319,501 | -0.5% | 1.6% |
| 2 | Japan | 37,538,080 | 268,011,183 | 3% | 1.5% |
| 3 | Philippines | 17,435,000 | 184,850,536 | -1.1% | -1.7% |
| 4 | Germany | 26,206,880 | 136,413,920 | 28.1% | 36.3% |
| 5 | Republic of Korea | 15,579,159 | 130,520,072 | -22.4% | 7.6% |
| 6 | Brazil | 26,516,161 | 130,137,612 | 4.2% | 5.9% |
| 7 | Thailand | 9,141,825 | 106,225,410 | -17.8% | 0.8% |
| 8 | Hong Kong | 12,297,476 | 103,399,923 | -13.6% | -12.7% |
| 9 | Italy | 17,420,195 | 95,387,411 | 2.1% | 4.8% |
| 10 | Russian Federation | 12,219,970 | 88,077,490 | 49.8% | 70.3% |
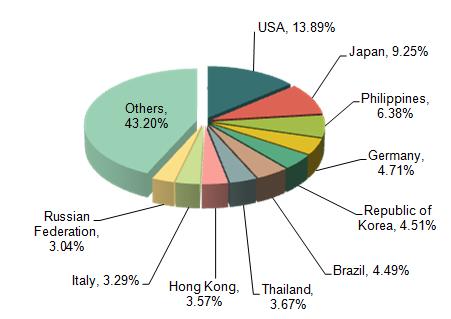
The export value of China umbrellas and sun umbrellas in 2014 amounted to 2897 million US dollars, an increase of 7.2% YOY. Major export markets are the United States, Japan, Philippines, Germany, South Korea, Brazil, Thailand, Hong Kong, Italy and the Russian Federation and etc.
The export value to the United States accounted for 13.89% of the total export value of the products in 2014, followed by Japan, accounting for 9.25%.
China Glassware (HS: 7013) Major Export Markets in 2014
| No. | Country/Region | Jan. - Dec. Total | Total YOY | ||
| Volume (Kg) | Value (USD) | Volume | Value | ||
| 1 | USA | 189,505,616 | 438,917,712 | -1.6% | -26.7% |
| 2 | Iran | 50,285,978 | 148,206,064 | 19.9% | -0.6% |
| 3 | United Arab Emirates | 42,007,228 | 124,632,972 | -8.1% | -24.6% |
| 4 | Malaysia | 26,094,496 | 115,068,998 | -40.9% | -43.9% |
| 5 | Germany | 41,673,091 | 104,745,800 | -8.6% | -35.6% |
| 6 | United Kingdom | 38,244,822 | 98,451,672 | 4.8% | -33.2% |
| 7 | Russian Federation | 36,688,202 | 95,726,649 | 4.5% | 18.8% |
| 8 | India | 33,861,649 | 92,325,494 | -18.5% | -39.4% |
| 9 | Egypt | 41,962,682 | 86,885,496 | 16.6% | 14.2% |
| 10 | Kazakhstan | 19,694,074 | 86,460,416 | -27.4% | -24.3% |
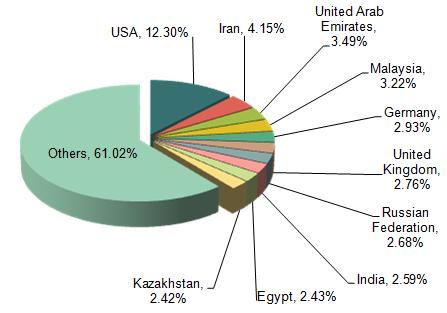
The export value of China glassware in 2014 amounted to 3570 million US dollars, a decrease of 25.7% YOY. Major export markets are the United States, Iran, the United Arab Emirates, Malaysia, Germany, the United Kingdom, the Russian Federation, India, Egypt and Kazakhstan and etc.
The export value to the United States accounted for 12.3% of the total export value of the products in 2014, followed by Iran, accounting for 4.15%.
China Household Articles of Iron or Steel and Parts (HS: 7323) Major Export Markets in 2014
| No. | Country/Region | Jan. - Dec. Total | Total YOY | ||
| Volume (Kg) | Value (USD) | Volume | Value | ||
| 1 | USA | 234,950,578 | 1,153,171,420 | -7.7% | 0.3% |
| 2 | Germany | 64,954,449 | 388,073,044 | 20.7% | 20.7% |
| 3 | Iran | 32,123,345 | 260,852,894 | 71.2% | 132.1% |
| 4 | United Kingdom | 47,323,623 | 222,243,785 | 0.2% | -1.8% |
| 5 | Netherlands | 36,488,593 | 214,275,680 | 8.4% | 2% |
| 6 | Russian Federation | 35,067,642 | 187,172,227 | 0.1% | 22.1% |
| 7 | Japan | 35,723,520 | 182,585,830 | 0.5% | -1.3% |
| 8 | Singapore | 26,153,601 | 179,615,787 | 68% | 27.7% |
| 9 | United Arab Emirates | 34,204,207 | 177,904,685 | 17.1% | 38.2% |
| 10 | Malaysia | 30,328,327 | 143,263,404 | 45.9% | 10.2% |
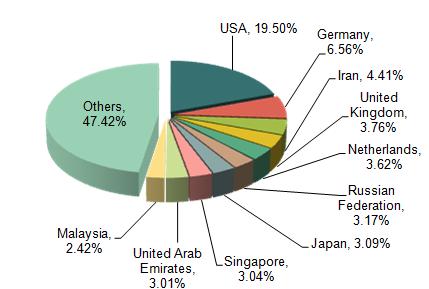
The export value of China household articles of iron or steel and parts in 2014 amounted to 5914 million US dollars, an increase of 5.1% YOY. Major export markets are the United States, Germany, Iran, the United Kingdom, the Netherlands, the Russian Federation, Japan, Singapore, the United Arab Emirates and Malaysia and etc.
The export value to the United States accounted for 19.5% of the total export value of the products in 2014, followed by Germany, accounting for 6.56%.
China Frames for Spectacles and Parts (HS: 9003) Major Export Markets in 2014
| No. | Country/Region | Jan. - Dec. Total | Total YOY | ||
| Volume (Kg) | Value (USD) | Volume | Value | ||
| 1 | Italy | 882,225 | 273,133,716 | 10.9% | 19.7% |
| 2 | USA | 1,713,245 | 256,987,392 | -4.7% | 24.6% |
| 3 | Hong Kong | 1,298,084 | 244,699,906 | -2.3% | 8.1% |
| 4 | Japan | 294,297 | 58,936,373 | -31.1% | -14.2% |
| 5 | Brazil | 278,870 | 48,462,783 | 17.1% | 18% |
| 6 | Germany | 292,214 | 45,760,266 | -10% | 17.2% |
| 7 | United Kingdom | 387,706 | 42,362,224 | -9.9% | 24.2% |
| 8 | India | 898,352 | 27,598,992 | -19.9% | 8.9% |
| 9 | France | 225,892 | 24,145,202 | 1.4% | 26.7% |
| 10 | Russian Federation | 375,563 | 23,534,359 | -12.8% | 36.9% |
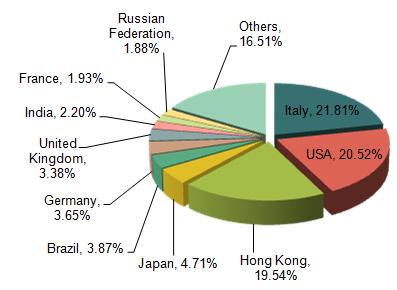
The export value of China frames for spectacles and parts in 2014 amounted to 1252 million US dollars, an increase of 15.1% YOY. Major export markets are Italy, the United States, Hong Kong, Japan, Brazil, Germany, the United Kingdom, India, France and the Russian Federation and etc.
The export value to Italy accounted for 21.81% of the total export value of the products in 2014, followed by the United States, accounting for 20.52%, and Hong Kong ranked the third, accounting for 19.54%.
China Clocks and Watches and Parts (HS: 91) Major Export Markets in 2014
| No. | Country/Region | Jan. - Dec. Total | Total YOY | ||
| Volume (Kg) | Value (USD) | Volume | Value | ||
| 1 | Hong Kong | 567,994,772 | 2,461,511,975 | -7.3% | -5.5% |
| 2 | USA | 125,515,076 | 560,305,833 | -8.8% | 2.9% |
| 3 | Japan | 79,143,741 | 334,068,654 | -7.9% | 15.8% |
| 4 | Germany | 47,489,401 | 166,209,470 | -9.5% | 1.5% |
| 5 | Switzerland | 9,095,038 | 115,315,830 | 97.5% | 41.1% |
| 6 | Russian Federation | 18,271,986 | 94,366,726 | 11% | 0.2% |
| 7 | Indonesia | 46,005,382 | 92,230,828 | 16.4% | -10.3% |
| 8 | Malaysia | 34,083,349 | 88,664,719 | 7.6% | -13.4% |
| 9 | India | 98,629,673 | 88,023,338 | -19.1% | -17.7% |
| 10 | United Kingdom | 22,244,138 | 72,281,448 | -1.1% | -4.1% |
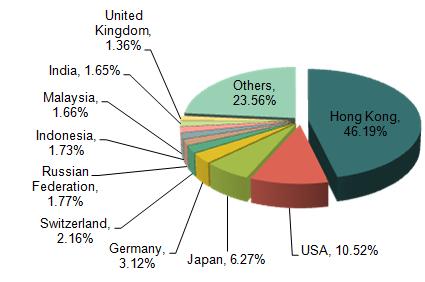
The export value of China clocks and watches and parts in 2014 amounted to 5329 million US dollars, a decrease of 4.4% YOY. Major export markets are Hong Kong, the United States, Japan, Germany, Switzerland, the Russian Federation, Indonesia, Malaysia, India, and the United Kingdom and etc.
The export value to Italy accounted for 46.19% of the total export value of the products in 2014, followed by the United States, accounting for 10.52%.
Source: Customs Information Network


