China Agricultural, Horticultural or Forestry Machinery for Soil Preparation or Cultivation; Lawn or Sports Ground Rollers (HS: 8432) Export Volume and Main Exporting Countries/Regions (By Export Value) from Jan. to May in 2013
| No. | Country/Region | Jan. to May Total | Total Year on Year | ||
| Volume (-) | Value (USD) | Volume | Value | ||
| 1 | USA | 11,794,442 | 49,620,820 | -8.9% | 9.1% |
| 2 | The Russian Federation | 1,076,832 | 39,084,064 | 20.1% | 35.0% |
| 3 | Japan | 4,008,641 | 26,990,410 | 22.7% | 30.8% |
| 4 | Ukraine | 454,578 | 26,394,105 | -14.3% | -22.8% |
| 5 | Finland | 141,255 | 11,302,649 | -3.3% | 16.0% |
| 6 | Italy | 1,941,746 | 10,928,573 | 10.6% | 17.9% |
| 7 | Turkey | 115,322 | 10,843,451 | 20.8% | -27.9% |
| 8 | Germany | 1,962,137 | 9,383,655 | 6.6% | -25.3% |
| 9 | Thailand | 1,841,117 | 7,306,986 | -5.7% | 63.3% |
| 10 | India | 1,502,191 | 6,069,728 | 72.6% | 2.5% |
| 11 | Canada | 1,767,442 | 5,965,079 | 96.2% | 61.6% |
| 12 | Republic of Korea | 670,593 | 5,846,356 | 21.4% | 53.7% |
| 13 | Spain | 636,154 | 5,412,197 | 6.7% | 43.1% |
| 14 | France | 1,351,907 | 5,277,601 | 3.9% | -18.8% |
| 15 | Denmark | 2,990,592 | 5,019,906 | 593.9% | 87.0% |
| 16 | Lithuania | 130,886 | 4,813,132 | 107.2% | 143.5% |
| 17 | Australia | 686,915 | 3,969,869 | -30.0% | -11.3% |
| 18 | Myanmar | 306,192 | 3,962,151 | 70.8% | 57.7% |
| 19 | UK | 808,357 | 3,922,813 | -30.9% | -17.5% |
| 20 | Poland | 759,547 | 3,409,290 | 81.6% | 38.2% |
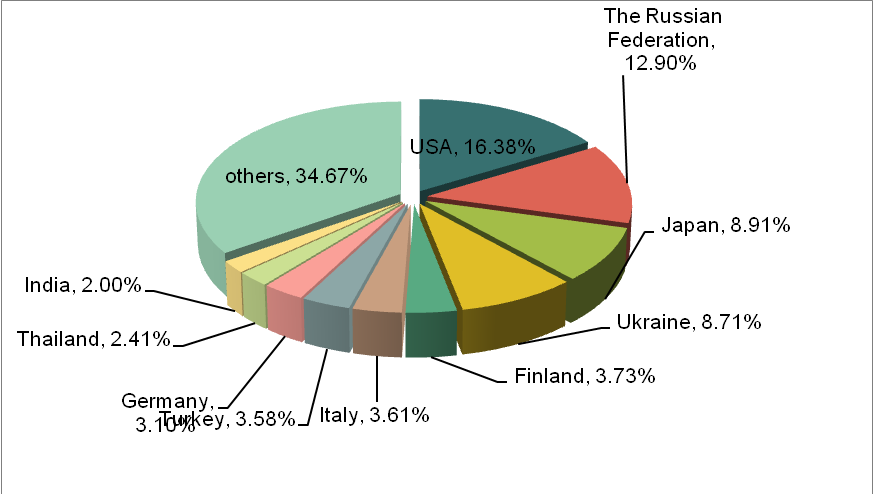
The export value of China Agricultural, Horticultural or Forestry Machinery for Soil Preparation or Cultivation; Lawn or Sports Ground Rollers amounted to 303 million USD, with an increase of 8.1% from Jan. to May in 2013. Major exporting countries / regions were the United States, the Russian Federation, Japan, Ukraine, Finland, Italy, Turkey, Germany, Thailand and India and so on. The United States was our main export market of Agricultural, Horticultural or Forestry Machinery for Soil Preparation or Cultivation; Lawn or Sports Ground Rollers, and The export value to the United States accounted for 16.38% of the total export value of the product. Among the top twenty exporting countries, the export value to Lithuania increased the fastest, with an increase of 143.5% year on year in the first five months of 2013.
China Harvesting or Threshing Machinery Including Straw or Fodder Balers; Grass or Hay Mowers; Machines For Cleaning, Sorting or Grading Eggs, Fruit or Other Agricultural Produce, Other than Machinery of Heading No. 8437 (HS: 8433) Export Volume and Main Exporting Countries/Regions (By Export Value) from Jan. to May in 2013
| No. | Country/Region | Jan. to May Total | Total Year on Year | ||
|
|
| Volume (-) | Value (USD) | Volume | Value |
| 1 | USA | 16,953,924 | 123,904,616 | 3.2% | 27.4% |
| 2 | Germany | 1,774,540 | 77,936,834 | -14.7% | -14.8% |
| 3 | UK | 1,306,175 | 58,431,695 | -6.0% | 26.4% |
| 4 | France | 665,594 | 33,137,932 | 29.5% | 66.7% |
| 5 | Vietnam | 1,788,833 | 28,123,102 | 109.6% | -14.8% |
| 6 | Japan | 2,341,153 | 27,986,855 | -5.5% | 3.5% |
| 7 | Netherlands | 1,159,187 | 26,659,269 | 10.0% | 8.6% |
| 8 | The Russian Federation | 1,041,615 | 25,429,002 | 20.0% | -8.5% |
| 9 | Poland | 665,285 | 24,844,301 | 2.3% | -13.1% |
| 10 | Italy | 951,038 | 22,242,430 | -25.7% | -34.5% |
| 11 | Sweden | 681,888 | 20,428,668 | 32.8% | 22.4% |
| 12 | Belgium | 498,268 | 15,188,128 | 21.5% | 23.3% |
| 13 | Ukraine | 411,678 | 13,975,441 | 45.1% | 17.8% |
| 14 | Finland | 254,142 | 12,447,548 | -20.1% | -10.7% |
| 15 | Canada | 455,320 | 12,073,740 | 25.4% | 8.0% |
| 16 | Denmark | 194,394 | 10,753,224 | -12.5% | -2.9% |
| 17 | Australia | 501,991 | 9,035,508 | -32.4% | -63.4% |
| 18 | Philippines | 23,988 | 8,820,814 | 76.2% | 56.9% |
| 19 | Indonesia | 256,993 | 8,390,853 | -20.3% | -1.3% |
| 20 | Thailand | 556,373 | 7,407,260 | -48.0% | -48.7% |
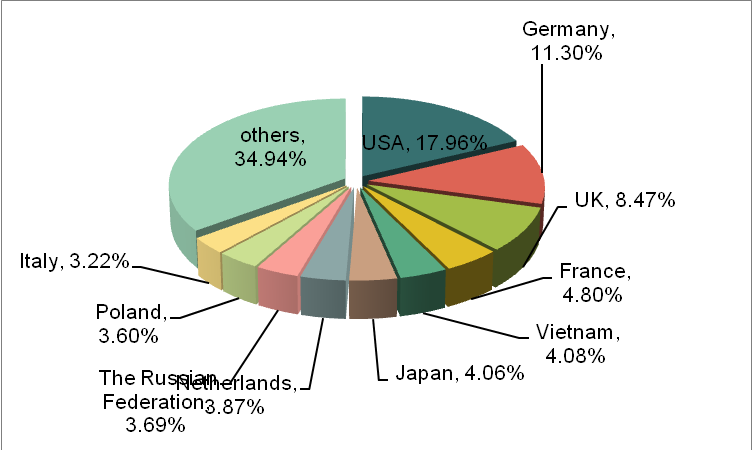
The export value of China Harvesting or Threshing Machinery Including Straw or Fodder Balers; Grass or Hay Mowers; Machines For Cleaning, Sorting or Grading Eggs, Fruit or Other Agricultural Produce, Other than Machinery of Heading No. 8437 amounted to 690 million USD, with a slight increase of 0.3% from Jan. to May in 2013. Major exporting countries / regions were the United States, Germany, Britain, France, Vietnam, Japan, the Netherlands, the Russian Federation, Poland and Italy and so on. The United States was our main export market of Harvesting or Threshing Machinery Including Straw or Fodder Balers; Grass or Hay Mowers; Machines for Cleaning, Sorting or Grading Eggs, Fruit or Other Agricultural Produce, Other than Machinery of Heading No. 8437, and the export value to the United States accounted for 17.96% of the total export value of the product.
China Milking Machines and Dairy Machinery (HS: 8434) Export Volume and Main Exporting Countries/Regions (By Export Value) from Jan. to May in 2013
| No. | Country/Region | Jan. to May Total | Total Year on Year | ||
|
|
| Volume (-) | Value (USD) | Volume | Value |
| 1 | Cuba | 2 | 4,433,580 | 0.0% | 0.0% |
| 2 | Indonesia | 133 | 2,458,810 | -46.8% | 4429% |
| 3 | India | 4,958 | 1,944,457 | 15.1% | -46.3% |
| 4 | Malaysia | 3,297 | 1,267,852 | -25.7% | -25.4% |
| 5 | USA | 73,637 | 1,223,463 | -44.2% | -4.0% |
| 6 | Denmark | 87,069 | 1,067,199 | 107.7% | 140.4% |
| 7 | Hong Kong | 43 | 1,048,406 | 0.0% | 0.0% |
| 8 | Germany | 23,225 | 788,925 | -23.0% | -29.1% |
| 9 | Egypt | 5,347 | 787,574 | -30.9% | 1.3% |
| 10 | The Russian Federation | 15,924 | 767,036 | 43.1% | 25.8% |
| 11 | Taiwan | 3,234 | 721,021 | 170.6% | 1479.2% |
| 12 | Brazil | 19,344 | 665,191 | -22.5% | 55.1% |
| 13 | Thailand | 6,635 | 560,267 | 43.4% | 279.7% |
| 14 | UK | 18,828 | 447,076 | -10.9% | -19.9% |
| 15 | Italy | 33,823 | 354,963 | -12.8% | -27.6% |
| 16 | Panama | 2,615 | 332,167 | -64.9% | 49.0% |
| 17 | France | 25,164 | 312,801 | -53.5% | -54.4% |
| 18 | Netherlands | 24,768 | 286,733 | -39.9% | -26.7% |
| 19 | Tanzania | 79 | 275,682 | 0.0% | 0.0% |
| 20 | Belgium | 18,934 | 253,979 | 28.0% | 11.8% |
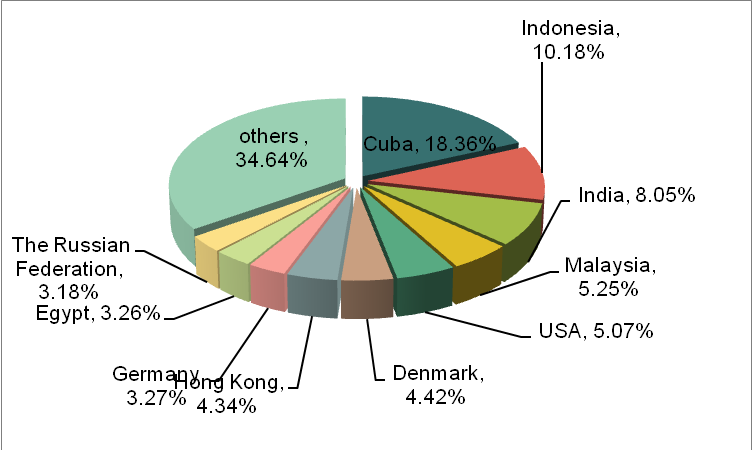
The export value of China Milking Machines and Dairy Machinery amounted to 24 million USD, with an increase of 29.5% from Jan. to May in 2013. Major exporting countries / regions were Cuba, Indonesia, India, Malaysia, United States, Denmark, Hong Kong, Germany, Egypt and the Russian Federation and so on. Cuba was our main export market of Milking Machines and Dairy Machinery, and the export value to Cuba accounted for 18.36% of the total export value of the product. Among the top twenty exporting countries, the export value to Indonesia, Denmark, Taiwan and Thailand rose more than 100%, 4429%, 140.4%, 1479.2% and 279.7% respectively in the first five months of 2013.
China Presses, Crushers and Similar Machinery Used in the Manufacture of Wine, Cider, Fruit Juices or Similar Beverages (HS: 8435) Export Volume and Main Exporting Countries/Regions (By Export Value) from Jan. to May in 2013
| No. | Country/Region | Jan. to May Total | Total Year on Year | ||
|
|
| Volume (-) | Value (USD) | Volume | Value |
| 1 | Austria | 5,001 | 438,661 | -34.9% | -18.8% |
| 2 | USA | 15,277 | 433,134 | -15.7% | 19.1% |
| 3 | Singapore | 4,658 | 385,984 | -7.5% | 746.0% |
| 4 | Denmark | 7,436 | 351,415 | 226.4% | 140.0% |
| 5 | Thailand | 4,548 | 330,756 | -72.1% | 12.1% |
| 6 | Philippines | 12,352 | 304,844 | 1112.2% | 380.0% |
| 7 | Germany | 14,672 | 302,054 | 9.4% | 99.6% |
| 8 | Malaysia | 34,999 | 282,459 | 1.9% | -8.4% |
| 9 | Japan | 22,246 | 276,278 | -15.7% | 6.1% |
| 10 | Hong Kong | 11,528 | 269,160 | 784.0% | 579.4% |
| 11 | Indonesia | 7,410 | 249,488 | 176.1% | 13.3% |
| 12 | South Africa | 3,585 | 178,737 | 2838.5% | 627.3% |
| 13 | India | 2,660 | 149,421 | 833.3% | 78.5% |
| 14 | Peru | 1,199 | 137,185 | 65.2% | 185.7% |
| 15 | Australia | 27,324 | 121,206 | -21.6% | -49.9% |
| 16 | Slovenia | 2,993 | 118,434 | 74725.0% | 3236.2% |
| 17 | Brazil | 676 | 112,440 | 20.5% | 1542.2% |
| 18 | UK | 4,164 | 86,696 | -0.4% | -78.9% |
| 19 | Bangladesh | 654 | 80,555 | 6440.0% | 2908.0% |
| 20 | Myanmar | 702 | 73,525 | -94.5% | -24.7% |
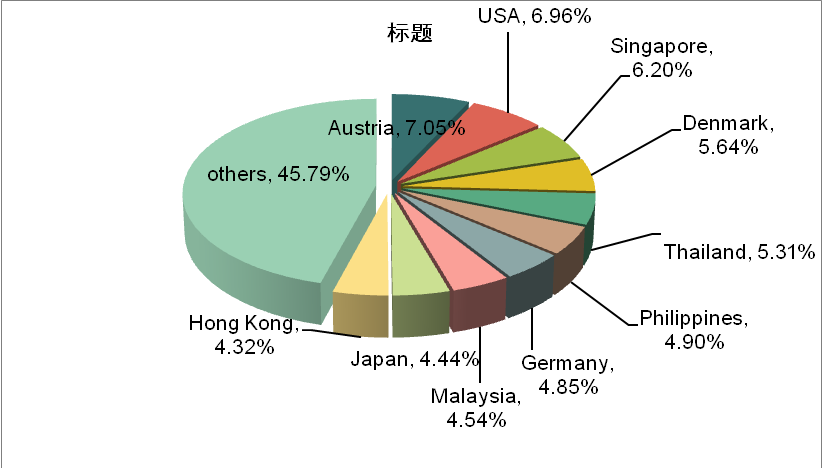
The export value of China Presses, Crushers and Similar Machinery Used in the Manufacture of Wine, Cider, Fruit Juices or Similar Beverages amounted to 6,226,000 USD, with an increase of 25.1% from Jan. to May in 2013. Major exporting countries / regions were Austria, the United States, Singapore, Denmark, Thailand, the Philippines, Germany, Malaysia, Japan and Hong Kong and so on. Austria was our main export market of Presses, Crushers and Similar Machinery Used in the Manufacture of Wine, Cider, Fruit Juices or Similar Beverages, and The export value to Austria accounted for 7.05% of the total export value of the product. The export market of China Presses, Crushers and Similar Machinery Used in the Manufacture of Wine, Cider, Fruit Juices or Similar Beverages were more dispersed, the main export market---Austria, only accounted for about 7% of china export market share.
China Other Agricultural, Horticultural, Forestry Poultry Keeping or Beekeeping Machinery, Including Germination Plant Fitted with Mechanical or Thermal Equipment; Poultry Incubators and Brooders (HS: 8436) Export Volume and Main Exporting Countries/Regions (By Export Value) from Jan. to May in 2013
| No. | Country/Region | Jan. to May Total | Total Year on Year | ||
|
|
| Volume (-) | Value (USD) | Volume | Value |
| 1 | USA | 1,669,533 | 15,882,741 | -17.1% | -4.9% |
| 2 | Germany | 1,502,548 | 15,203,872 | 6.5% | -10.4% |
| 3 | Netherlands | 2,362,461 | 10,183,676 | -11.2% | -8.3% |
| 4 | Indonesia | 140,126 | 8,971,033 | -9.9% | 37.4% |
| 5 | Thailand | 160,914 | 7,341,622 | -47.3% | -10.1% |
| 6 | India | 93,050 | 6,998,227 | 1.3% | 121.2% |
| 7 | Philippines | 59,600 | 6,926,007 | -9.8% | 1.1% |
| 8 | Vietnam | 158,321 | 5,700,087 | -26.2% | -8.7% |
| 9 | Republic of Korea | 478,037 | 5,415,251 | 28.9% | -20.8% |
| 10 | Japan | 245,975 | 4,816,772 | 0.5% | -14.3% |
| 11 | Pakistan | 17,960 | 4,600,702 | -11.5% | -34.5% |
| 12 | UK | 201,540 | 4,244,435 | 42.8% | 9.1% |
| 13 | Malaysia | 198,988 | 4,200,921 | 79.3% | -16.4% |
| 14 | Bangladesh | 50,567 | 3,736,595 | -12.3% | 116.3% |
| 15 | Australia | 239,491 | 3,391,935 | -26.7% | -37.0% |
| 16 | Libya | 5,766 | 2,895,795 | 168.6% | 4491.4% |
| 17 | The Russian Federation | 43,196 | 2,608,099 | 39.6% | 49.0% |
| 18 | Brazil | 74,066 | 2,518,917 | 278.1% | 11.5% |
| 19 | Canada | 259,725 | 2,282,329 | 96.0% | 36.7% |
| 20 | Nigeria | 107,818 | 2,131,396 | 21.6% | 16.1% |
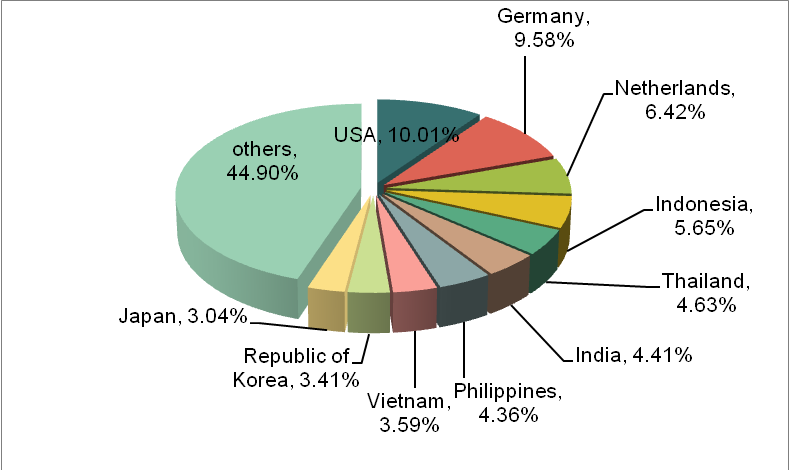
The export value of China Other Agricultural, Horticultural, Forestry Poultry Keeping or Beekeeping Machinery, Including Germination Plant Fitted with Mechanical or Thermal Equipment; Poultry Incubators and Brooders amounted to 159 million USD, with a decrease of 2.2% from Jan. to May in 2013. Major exporting countries / regions were the United States, Germany, the Netherlands, Indonesia, Thailand, India, Philippines, Vietnam, Korea and Japan and so on. The United States was our main export market of Other Agricultural, Horticultural, Forestry Poultry Keeping or Beekeeping Machinery, Including Germination Plant Fitted with Mechanical or Thermal Equipment; Poultry Incubators and Brooders, and The export value to the United States accounted for 10.01% of the total export value of the product. Among the top twenty exporting countries, the export value to India, Bangladesh and Libya rose more than 100%, 121.2%, 116.3% and 4491.4% respectively.
China Machines for Cleaning, Sorting or Grading Seed, Grain or Dried Leguminous Vegetables; Machinery Used in the Milling Industry or for the Working of Cereals or Dried Leguminous Vegetables, other than Farmtype Machinery (HS: 8437) Export Volume and Main Exporting Countries/Regions (By Export Value) from Jan. to May in 2013
| No. | Country/Region | Jan. to May Total | Total Year on Year | ||
|
|
| Volume (-) | Value (USD) | Volume | Value |
| 1 | India | 727,542 | 17,415,552 | 36.4% | 39.2% |
| 2 | Vietnam | 37,604 | 8,191,998 | 3.1% | 72.4% |
| 3 | Indonesia | 839,110 | 8,189,748 | -9.7% | -10.1% |
| 4 | Thailand | 168,818 | 7,099,048 | 126.3% | 154.3% |
| 5 | Bangladesh | 597,071 | 6,600,111 | -35.1% | 11.0% |
| 6 | Myanmar | 478,783 | 5,769,708 | 2.8% | 42.9% |
| 7 | Philippines | 663,691 | 5,575,777 | 8.2% | -0.6% |
| 8 | Switzerland | 1,161,284 | 4,955,587 | 25.9% | 37.0% |
| 9 | USA | 673,228 | 4,003,344 | 82.2% | 48.1% |
| 10 | Pakistan | 819,822 | 3,723,964 | 21.7% | 26.8% |
| 11 | Sri Lanka | 186,228 | 3,261,020 | -32.8% | -1.1% |
| 12 | Egypt | 155,776 | 2,815,318 | 42.1% | 177.3% |
| 13 | Malaysia | 198,181 | 2,131,706 | 14.2% | 23.5% |
| 14 | Kenya | 59,631 | 2,111,132 | 195.4% | 71.0% |
| 15 | The Russian Federation | 31,996 | 1,854,328 | 33.4% | 32.3% |
| 16 | Ethiopia | 8,594 | 1,694,243 | 32953.8% | -31.4% |
| 17 | Tanzania | 188,862 | 1,688,343 | -34.1% | -26.4% |
| 18 | South Africa | 184,829 | 1,637,210 | 82.3% | 45.1% |
| 19 | Cambodia | 1,543 | 1,612,556 | -69.9% | -30.7% |
| 20 | Madagascar | 172,689 | 1,515,447 | 15.0% | 46.8% |
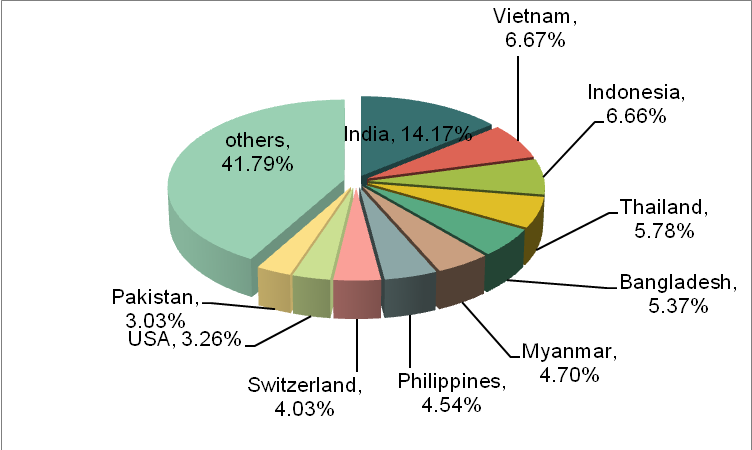
The export value of China Machines for Cleaning, Sorting or Grading Seed, Grain or Dried Leguminous Vegetables; Machinery Used in the Milling Industry or for the Working of Cereals or Dried Leguminous Vegetables, other than Farmtype Machinery amounted to 123 million USD, with an increase of 15.0% from Jan. to May in 2013. Major exporting countries / regions were India, Vietnam, Indonesia, Thailand, Bangladesh, Myanmar, the Philippines, Switzerland, the United States and Pakistan and so on. India was our main export market of Machines for Cleaning, Sorting or Grading Seed, Grain or Dried Leguminous Vegetables; Machinery Used in the Milling Industry or for the Working of Cereals or Dried Leguminous Vegetables, other than Farmtype Machinery, and The export value to India accounted for 14.17% of the total export value of the product. Among the top twenty exporting countries, the export value to Thailand and Egypt rose more than 100%, 154.3% and 177.3% respectively.
China Machinery, Not Specified or Included Elsewhere in this Chapter, for the Industrial Preparation or Manufacture of Food or Drink, other than Machinery for the Extraction or Preparation of Animal or Fixed Vegetable Fats or Oils (HS: 8438) Export Volume and Main Exporting Countries/Regions (By Export Value) from Jan. to May in 2013
| No. | Country/Region | Jan. to May Total | Total Year on Year | ||
|
|
| Volume (-) | Value (USD) | Volume | Value |
| 1 | USA | 941,148 | 28,542,600 | 38.0% | 29.0% |
| 2 | Ethiopia | 2,755 | 16,721,103 | 1712.5% | 12686.5% |
| 3 | Indonesia | 597,513 | 16,151,604 | 47.3% | -15.0% |
| 4 | India | 79,724 | 14,235,293 | 18.0% | 59.1% |
| 5 | Thailand | 621,529 | 11,715,449 | -54.6% | 11.6% |
| 6 | The Russian Federation | 30,793 | 9,978,169 | -23.5% | 32.0% |
| 7 | Malaysia | 69,389 | 8,653,260 | -41.2% | 22.7% |
| 8 | Vietnam | 115,072 | 7,843,202 | -67.4% | -45.7% |
| 9 | Chile | 37,605 | 7,245,898 | 287.6% | 167.3% |
| 10 | Nigeria | 38,521 | 7,206,604 | 39.9% | 220.3% |
| 11 | Japan | 165,844 | 7,034,947 | -20.4% | 7.7% |
| 12 | Hong Kong | 93,832 | 6,348,998 | 2.1% | 188.1% |
| 13 | Bangladesh | 17,897 | 6,177,683 | 11.4% | 28.7% |
| 14 | Germany | 132,045 | 5,514,101 | -47.2% | 31.1% |
| 15 | Netherlands | 687,649 | 5,486,024 | 134.0% | -0.8% |
| 16 | Benin | 140 | 4,946,481 | -90.6% | 1260.8% |
| 17 | Philippines | 8,948 | 4,400,363 | -37.8% | -5.1% |
| 18 | Canada | 43,472 | 4,339,364 | -41.2% | 7.4% |
| 19 | Australia | 152,599 | 4,179,643 | -3.2% | -11.7% |
| 20 | Italy | 198,170 | 4,177,373 | 0.8% | 17.9% |
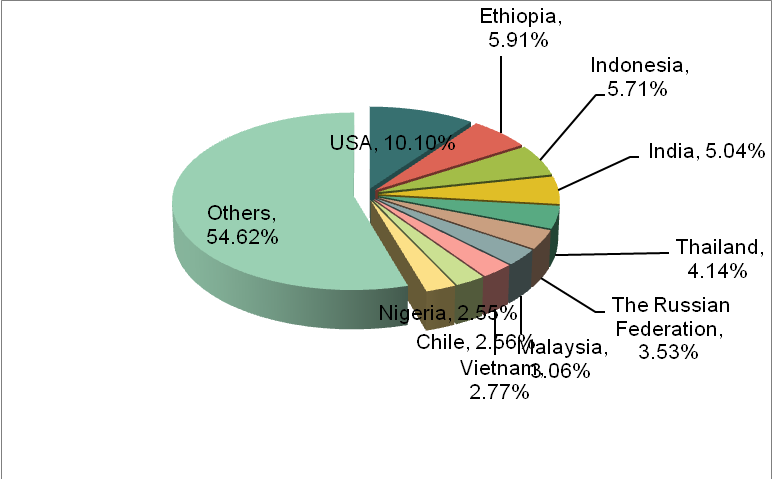
The export value of China Machinery, Not Specified or Included Elsewhere in this Chapter, for the Industrial Preparation or Manufacture of Food or Drink, other than Machinery for the Extraction or Preparation of Animal or Fixed Vegetable Fats or Oils amounted to 283 million USD, with an increase of 22.5% from Jan. to May in 2013. Major exporting countries / regions were the United States, Ethiopia, Indonesia, India, Thailand, Russia, Malaysia, Vietnam, Chile and Nigeria and so on. the United States was our main export market of Machinery, Not Specified or Included Elsewhere in this Chapter, for the Industrial Preparation or Manufacture of Food or Drink, other than Machinery for the Extraction or Preparation of Animal or Fixed Vegetable Fats or Oils, and The export value to the United States accounted for 10.1% of the total export value of the product
Source: China Customs


