China Footwear, Leggings & Accessories Export Volume and Sales Statistics, from Jan. to Dec. 2014
| Month | Volume (KG) | Value (USD) | Year-on-Year | |
| Volume | Value | |||
| Jan. | 543,972,920 | 6,394,062,873 | 11.6% | 16.8% |
| Feb. | 203,133,561 | 2,419,393,120 | -33.9% | -28.4% |
| Mar. | 292,038,211 | 3,153,477,224 | 13% | 16.9% |
| Apr. | 393,441,602 | 4,104,709,400 | 15.8% | 21.3% |
| May. | 418,738,172 | 4,506,960,860 | 9.9% | 15.7% |
| Jun. | 443,521,019 | 4,984,579,431 | 8.5% | 16% |
| Jul. | 516,452,506 | 6,033,429,759 | 17.8% | 27.6% |
| Aug. | 493,725,094 | 5,896,070,575 | 14.5% | 26.1% |
| Sep. | 426,952,096 | 5,128,849,993 | 0.5% | 12.7% |
| Oct. | 380,446,864 | 4,319,128,989 | -1.2% | 3.4% |
| Nov. | 356,079,183 | 4,174,426,816 | -2.6% | 0.6% |
| Dec. | 415,152,845 | 5,135,344,411 | -7.2% | -4.1% |
| Total from Jan. to Dec. | 4,883,654,073 | 56,250,433,451 | 4.5% | 10.8% |
The total export volume and export sales for China footwear, leggings & accessories achieved 4.88 million tons and 56.25 billion USD respectively, from Jan. to Dem. 2014, and increased 10.8% year-on-year.
Top Countries/Regions That China Exports Footwear, Leggings & Accessories to, from Jan. to Dec. 2014
| No. | Country/Region | Volume (KG) | Value (USD) | Year-on-Year | |
| Volume | Value | ||||
| 1 | United States | 955,366,606 | 13,841,649,295 | 2.1% | 4.4% |
| 2 | Russian Federation | 191,197,629 | 3,097,652,385 | -16.7% | -1.1% |
| 3 | Japan | 235,260,239 | 2,713,688,111 | -3.1% | -2.8% |
| 4 | United Kingdom | 233,693,090 | 2,495,833,275 | 29.6% | 25.4% |
| 5 | Germany | 196,311,126 | 2,345,774,113 | 11% | 9.6% |
| 6 | Kazakhstan | 151,417,341 | 2,234,159,423 | 74% | 110.6% |
| 7 | Hong Kong | 126,812,436 | 1,806,329,337 | -0.3% | -0.1% |
| 8 | Republic of Korea | 88,149,975 | 1,274,319,670 | 33.1% | 55% |
| 9 | Netherlands | 101,420,893 | 1,273,342,799 | 24% | 15.7% |
| 10 | Malaysia | 115,326,226 | 1,236,819,571 | -8.2% | 1.7% |
| 11 | United Arab Emirates | 115,637,037 | 1,198,806,011 | -2.1% | 6.8% |
| 12 | Spain | 91,358,201 | 1,001,470,930 | 11.1% | 10.3% |
| 13 | Belgium | 75,598,469 | 977,360,473 | 27% | 20.7% |
| 14 | France | 82,214,514 | 965,387,110 | 9.6% | 13.3% |
| 15 | Canada | 66,998,581 | 890,087,617 | 3.7% | 7.4% |
| 16 | Italy | 64,758,150 | 835,245,217 | 23.4% | 19% |
| 17 | South Africa | 88,655,951 | 766,390,175 | -7.5% | -10.2% |
| 18 | Australia | 52,945,542 | 707,688,055 | -2.5% | 2.1% |
| 19 | Vietnam | 50,508,102 | 678,826,968 | 39.6% | 73.9% |
| 20 | Singapore | 61,646,489 | 678,416,169 | -5.2% | -2% |
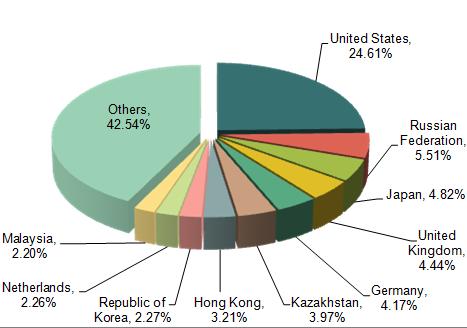
From Jan. to Dem. 2014 export data, we can include that top countries/regions that China exports footwear, leggings & accessories to are the United States, Russian Federation, Japan, United Kingdom, Germany, Kazakhstan, Hong Kong, Republic of Korea, Netherland, Malaysia and so on.
Top three markets that China exports footwear, leggings & accessories to are the United States, Russian Federation and Japan. The export sales percentage to these three markets account for China total export sales of footwear, leggings & accessories are 24.61%, 5.51% and 4.82% respectively.
From Jan. to Dec., the export sales to Kazakhstan grows the fastest among the top 20 markets that China exports knitted or crocheted apparel & accessories to, which grows 110.6% compared to the same period of 2013.
Regions of Origin for Exported Footwear, Leggings & Accessories, from Jan. to Dec. 2014
| No. | Region | Volume (KG) | Value (USD) | Year-on-Year | |
| Volume | Value | ||||
| 1 | Guangdong | 1,526,277,256 | 19,438,524,175 | 2% | 9% |
| 2 | Zhejiang | 1,283,377,380 | 10,956,190,695 | 2.8% | 10.5% |
| 3 | Fujian | 949,420,082 | 10,917,540,384 | -0.5% | 1.8% |
| 4 | Xinjiang | 242,194,037 | 3,188,307,409 | 72.7% | 113.1% |
| 5 | Jiangsu | 226,964,475 | 2,305,873,770 | 8.8% | 4% |
| 6 | Jiangxi | 124,895,233 | 1,638,180,877 | 30.7% | 30% |
| 7 | Shandong | 112,520,089 | 1,328,855,384 | 12.2% | 8.6% |
| 8 | Sichuan | 56,881,079 | 1,169,647,012 | 4.4% | 5% |
| 9 | Heilongjiang | 46,002,996 | 951,789,713 | -20% | 9.9% |
| 10 | Shanghai | 57,472,586 | 714,456,346 | -15.1% | -9.7% |
Guangdong, Zhejiang, Fujian are the main original places of exported footwear, leggings & accessories, the export sales of these three provinces respectively accounts for 34.56%, 19.48%, 19.41% of the total export value of Chinese knitted or crocheted apparel & accessories.
From Jan. to Dec., the export sales of Xinjiang grows the fastest among the top 10 regions of origin for exported footwear, leggings & accessories, which grows 113.1% compared to the same period of 2013.


