2011-2013 Yearly Export Volume Trend for China Medicine
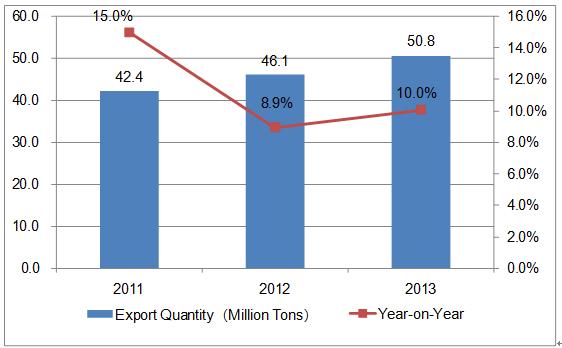
The export volume of China Medicine from 2011-2013 increased year by year, the volume respectively is 0.424 million tons, 0.461 million tons, and 0.508 million tons, increased 15%, 8.9% and, 10% year-on –year.
2011-2013 Monthly Export Volume Trend for China Medicine (Unit: Ton)
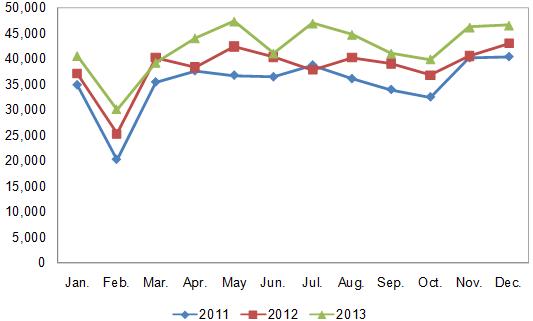
You can see from the chart, the export peak is in February and the export trough is in during November to December.
2011-2013 Yearly Export Sales Trend for China Medicine
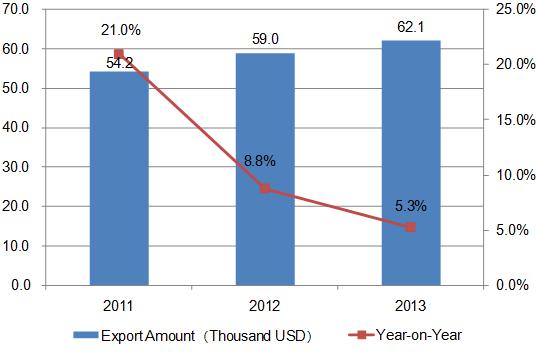
The export sales of Medicine from 2011 to 2013 increased year by year, but the growth rate has slowed down year by year, the medicine export sales is respectively 5.42 billion USD, 5.9 billion USD and 6.21 billion USD, increased 21%, 8.8% and 5.3% Year-on-Year.
2011-2013 Monthly Export Sales Trend for China Medicine (Unit: USD)
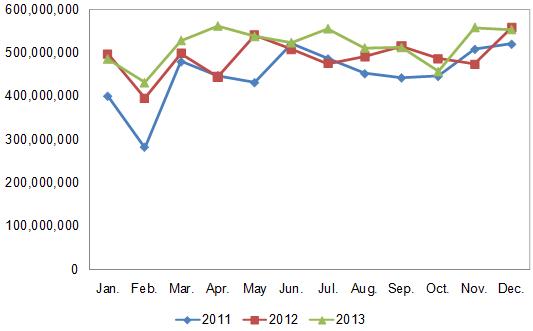
The monthly export value and export volume trend of China Medicine from 2011 to 2013 are similar, the export peak is during November and December, and the export trough is in February.
2011-2013 Medicine Export Average Unit Price Trend
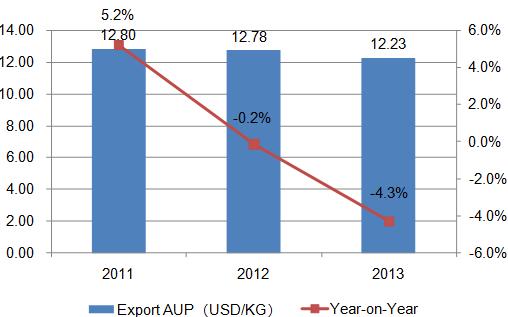
China export medicine from 2011-2013 shows a decrease trend from 2011 to 2013, the average unite price of 2013 is 12.23 USD/KG, decreased 4.3% compared to the same period of 2012.
2011-2013 Medicine Major Export Countries/Regions Trend for China
| No. | County/Region | Export Sales (USD ) | Sales Growth in 2013 Compared with 2010 | ||
| 2011 | 2012 | 2013 | |||
| 1 | United States | 917,379,387 | 964,955,097 | 1,042,692,098 | 13.66% |
| 2 | Australia | 489,652,946 | 649,851,734 | 575,822,417 | 17.60% |
| 3 | Germany | 367,478,019 | 316,070,173 | 322,969,438 | -12.11% |
| 4 | Republic of Korea | 173,851,368 | 274,303,477 | 307,299,924 | 76.76% |
| 5 | France | 335,148,306 | 324,382,672 | 265,442,010 | -20.80% |
| 6 | Hong Kong | 229,430,606 | 264,208,533 | 257,533,192 | 12.25% |
| 7 | Japan | 260,525,997 | 292,765,799 | 255,471,389 | -1.94% |
| 8 | India | 171,862,272 | 178,990,930 | 220,137,223 | 28.09% |
| 9 | United Kingdom | 141,308,871 | 162,712,832 | 182,942,683 | 29.46% |
| 10 | Nigeria | 93,059,072 | 90,095,512 | 114,863,760 | 23.43% |
2013 top three markets China export medicine from is the United States, Australia and Germany, the export sales to the three countries accounted for 16.76%, 9.25%, 5.19% of total export sales of China, the United States and Germany are the largest demand markets for medicine products.
2011-2013 Export Market Share Trend for Chinese Medicine
| No. | County/Region | Export Value Percentage | ||
| 2011 | 2012 | 2013 | ||
| 1 | United States | 16.92% | 16.36% | 16.76% |
| 2 | Australia | 9.03% | 11.02% | 9.25% |
| 3 | Germany↓ | 6.78% | 5.36% | 5.19% |
| 4 | Republic of Korea↑ | 3.21% | 4.65% | 4.94% |
| 5 | France↓ | 6.18% | 5.50% | 4.27% |
| 6 | Hong Kong | 4.23% | 4.48% | 4.14% |
| 7 | Japan | 4.81% | 4.96% | 4.11% |
| 8 | India | 3.17% | 3.04% | 3.54% |
| 9 | United Kingdom↑ | 2.61% | 2.76% | 2.94% |
| 10 | Nigeria | 1.72% | 1.53% | 1.85% |
Note: "↑"represents that the data listed continued to increase from 2011 to 2013, “↓”represents that the data listed continued to decrease from 2011 to 2013.
In terms of export sales share, the export sales share from China to Republic of Korea and United Kingdom continued to increase but the export sales share from China to Germany and France continued to decrease from 2011 to 2013.
Source: China Customs


