Note:
| HS Code | Product Name |
| 7304 | Tubes, pipes and hollow profiles, seamless, of iron (other than cast iron) or steel, hereinafter referred to as " Tubes, Pipes and Hollow Profiles, Seamless, of Iron or Steel " |
2011-2013 China Tubes, Pipes and Hollow Profiles, Seamless, of Iron or Steel Export Quantity Trend
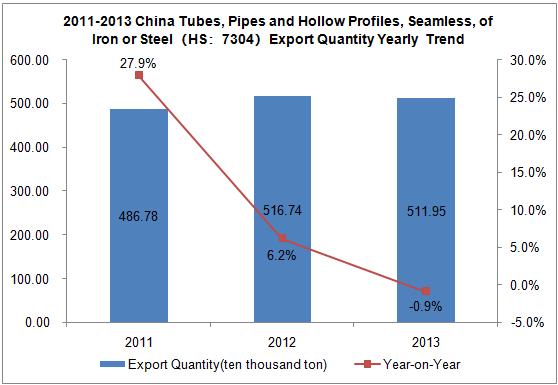
As can be seen from the above chart, China Tubes, pipes and hollow profiles, seamless, of iron or steel Export Quantity featured an inverted V year-on-year (YOY) from 2011 to 2013. The export quantity are 486.78million tons (increased 27.9%YOY), 516.74 million tons (increased 6.2%YOY), 511.95 million tons (decreased 0.9%YOY) from 2011 to 2013.
2011-2013 China Tubes, Pipes and Hollow Profiles, Seamless, of Iron or Steel Export Value Trend
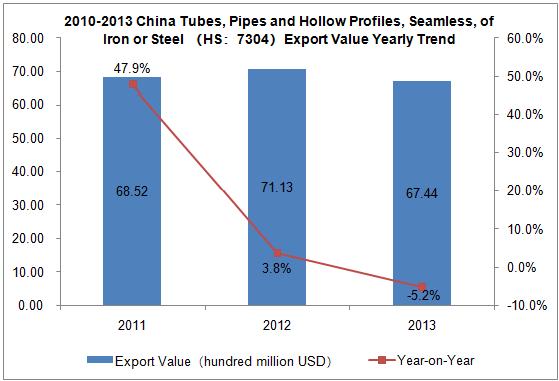
As can be seen from the above chart, China Tubes, pipes and hollow profiles, seamless, of iron or steel export value featured an inverted V from 2011 to 2013. The export values are 68.52 hundred million USD (increased 47.9%YOY), 71.13 hundred million USD (increased 3.8%YOY), and 67.44 hundred million USD (decreased 5.2% YOY) from 2011 to 2013.
2013 China Tubes, Pipes and Hollow Profiles, Seamless, of Iron or Steel Export Monthly Volume and Value
| Month | Volume (Kg) | Value (USD) | Year-on-Year | |
| Volume | Value | |||
| Jan. | 442,064,989 | 575,234,136 | 8.40% | -5.40% |
| Feb. | 432,586,560 | 555,979,432 | 35% | 25.90% |
| Mar. | 415,979,989 | 528,167,232 | -5% | -13% |
| Apr. | 459,299,715 | 616,208,961 | 25.20% | 17.80% |
| May | 469,284,432 | 627,317,795 | -2.10% | -6% |
| Jun. | 425,625,330 | 562,498,080 | -11.80% | -16.50% |
| Jul. | 410,196,680 | 553,152,739 | -12.90% | -14.70% |
| Aug. | 451,345,391 | 597,122,853 | 3.60% | -0.70% |
| Sep. | 371,890,685 | 494,986,874 | -24.30% | -24.50% |
| Oct. | 394,373,365 | 509,674,982 | 1.10% | -4.60% |
| Nov. | 427,542,351 | 561,033,145 | -9.60% | -8.10% |
| Dec. | 419,262,282 | 562,485,859 | 2.10% | 4% |
During Jan. to Dec. 2013, the peak of the export volume appears in May. Compared 2013 with 2011, the Export Quantity decreased by 2.1%, Export Value decreased by 6%.
2011-2013 China Tubes, Pipes and Hollow Profiles, Seamless, of Iron or Steel Export Markets Analysis
| No. | Export Countries/Regions | Export Value(USD) | Export Value Growth Compared 2013 with 2011 | ||
| 2011 | 2012 | 2013 | |||
| 1 | India | 829,819,345 | 707,871,362 | 556,129,188 | -32.98% |
| 2 | Republic of Korea | 499,329,120 | 496,495,474 | 431,897,485 | -13.50% |
| 3 | Venezuela | 263,368,428 | 348,211,541 | 355,277,200 | 34.90% |
| 4 | Russian Federation | 129,086,616 | 162,906,047 | 343,800,908 | 166.33% |
| 5 | United Arab Emirates | 405,906,102 | 326,187,023 | 316,543,957 | -22.02% |
| 6 | Iran | 273,325,837 | 461,852,981 | 284,085,416 | 3.94% |
| 7 | Kazakhstan | 135,609,311 | 174,369,507 | 266,343,696 | 96.41% |
| 8 | USA | 348,344,933 | 340,533,477 | 246,322,623 | -29.29% |
| 9 | Indonesia | 237,825,904 | 281,234,363 | 246,001,218 | 3.44% |
| 10 | Turkey | 88,332,634 | 183,678,098 | 208,542,311 | 136.09% |
| 11 | Canada | 362,315,432 | 296,799,775 | 208,539,593 | -42.44% |
| 12 | Saudi Arabia | 135,714,661 | 108,021,016 | 187,828,277 | 38.40% |
| 13 | Singapore | 209,651,275 | 275,499,081 | 178,862,855 | -14.69% |
| 14 | Thailand | 160,329,066 | 224,754,694 | 173,766,445 | 8.38% |
| 15 | Oman | 106,824,635 | 234,407,264 | 168,235,342 | 57.49% |
| 16 | Kuwait | 197,602,256 | 116,772,518 | 166,553,010 | -15.71% |
| 17 | Iraq | 128,380,493 | 132,948,708 | 161,966,435 | 26.16% |
| 18 | Turkmenistan | 70,839,269 | 139,351,942 | 125,118,844 | 76.62% |
| 19 | Australia | 79,901,170 | 136,919,698 | 124,262,464 | 55.52% |
| 20 | Egypt | 116,047,155 | 190,765,340 | 120,320,007 | 3.68% |
India, Republic of Korea and Venezuela were the first three importing countries of China Tubes, pipes and hollow profiles, seamless, of iron or steel export. Notable is,2011 China Tubes, pipes and hollow profiles, seamless, of iron or steel export value to Venezuela was only ranked 7th. 2013,Venezuela is in the top three.
2013 China Tubes, pipes and hollow profiles, seamless, of iron or steel export value to India, Republic of Korea, Venezuela amounted to 5.56 hundred million USD,4.32 hundred million USD,3.55 hundred million USD,compared with 2011, the export value increased by -32.98%,-13.5% and 34.9%.
Among the top twenty export markets, China Tubes, Pipes and Hollow Profiles, Seamless, of Iron or Steel export to Russian Federation had the largest rise, which increased by 166.33% compared 2013 with 2011. The second country was Turkey, the 2013 export value Increased 136.09% compared to that of 2011.
2011-2013 China Tubes, Pipes and Hollow Profiles, Seamless, of Iron or Steel Export Market Share Analysis
| No. | Export Countries/Regions | Value Percentage | ||
| 2011 | 2012 | 2013 | ||
| 1 | India↓ | 12.11% | 9.95% | 8.25% |
| 2 | Republic of Korea↓ | 7.29% | 6.98% | 6.40% |
| 3 | Venezuela↑ | 3.84% | 4.90% | 5.27% |
| 4 | Russian Federation↑ | 1.88% | 2.29% | 5.10% |
| 5 | United Arab Emirates | 5.92% | 4.59% | 4.69% |
| 6 | Iran | 3.99% | 6.49% | 4.21% |
| 7 | Kazakhstan↑ | 1.98% | 2.45% | 3.95% |
| 8 | USA↓ | 5.08% | 4.79% | 3.65% |
| 9 | Indonesia | 3.47% | 3.95% | 3.65% |
| 10 | Turkey↑ | 1.29% | 2.58% | 3.09% |
| 11 | Canada↓ | 5.29% | 4.17% | 3.09% |
| 12 | Saudi Arabia | 1.98% | 1.52% | 2.79% |
| 13 | Singapore | 3.06% | 3.87% | 2.65% |
| 14 | Thailand | 2.34% | 3.16% | 2.58% |
| 15 | Oman | 1.56% | 3.30% | 2.49% |
| 16 | Kuwait | 2.88% | 1.64% | 2.47% |
| 17 | Iraq | 1.87% | 1.87% | 2.40% |
| 18 | Turkmenistan | 1.03% | 1.96% | 1.86% |
| 19 | Australia | 1.17% | 1.93% | 1.84% |
| 20 | Egypt | 1.69% | 2.68% | 1.78% |
Note: "↑" represents that the indicators listed continued to increase from 2011 to 2013, "↓" represents that the indicators listed continued to decrease from 2011 to 2013.
The data of 2013 shows, India, Republic of Korea, Venezuela, as the first three largest export markets, accounted for 8.25%, 6.4%, and 5.27% of the total Export Value of this product.
Judging from the three-year market share, the import value in proportion of Venezuela, Russian Federation, Kazakhstan, Turkey continued to rise, while that of the India, Republic of Korea, USA continued to decline.
2013 China Tubes, Pipes and Hollow Profiles, Seamless, of Iron or Steel Original Places of Exported Goods
| No. | Regions | Volume (Kg) | Value (USD) | Compared to the same period last year | |
| Volume | Value | ||||
| 1 | Jiangsu | 1,380,878,850 | 2,003,850,524 | 1.10% | 3% |
| 2 | Tianjin | 981,170,866 | 1,181,214,812 | 14.60% | 3.60% |
| 3 | Zhejiang | 156,763,707 | 593,305,974 | -0.40% | -8.70% |
| 4 | Shandong | 496,404,319 | 566,962,719 | -15.70% | -9.90% |
| 5 | Hunan | 530,173,907 | 564,474,409 | -8.80% | -21.80% |
| 6 | Sichuan | 391,156,247 | 423,707,739 | 7.20% | -6.40% |
| 7 | Hebei | 415,973,146 | 396,396,991 | -3.50% | -9.10% |
| 8 | Shanghai | 219,485,897 | 375,305,920 | -7.90% | -7.90% |
| 9 | Anhui | 208,501,974 | 184,021,797 | -6.10% | -13.70% |
| 10 | Hubei | 120,816,929 | 140,547,842 | -7.50% | -23% |
China's Tubes, Pipes and Hollow Profiles, Seamless, of Iron or Steel were exported mainly from Jiangsu and Tianjin, from Jan. to Dec. 2013. Above two provinces, their export quantity accounted for 46.14%of China's total export quantity for the product, while their export value accounted for47.23% of China's total export value for this product.


