Product Description
| HS Code | Product Name | |
| Chapter 61 | 6101 | Men's knitting coat, cloak, hoody (including ski wear), dust coat, etc., products HS: 6103 are excluded |
|
| 6102 | Women's knitting coat, cloak, hoody (including ski wear), dust coat, etc., products HS: 6104 are excluded |
|
| 6103 | Men's knitting suit, leisure apparel, overall, breeches and shorts (trunks are excluded) |
|
| 6104 | Women's knitting suit, leisure apparel, top, dress, skirt, trousers, overall, breeches and shorts (swimwear is excluded) |
|
| 6105 | Men's knitting shirt |
|
| 6106 | Women's knitting shirt |
|
| 6107 | Men's knitting underpants, briefs, nightgown, pajamas, bathrobe, dressing gown, etc. |
|
| 6108 | Women's knitting petticoat, briefs, panties, nightgown, pajamas, bathrobe, dressing gown, etc. |
|
| 6109 | Knitting t-shirt, singlet and other tank tops |
|
| 6110 | Knitting pullover, cardigan, vest, etc. |
|
| 6111 | Knitting infant apparel & accessories |
|
| 6112 | Knitting sports wear, ski wear and swimwear |
|
| 6113 | Knitting apparel made from products HS: 5903, 5906 or 5907 |
|
| 6114 | Other knitting apparel |
|
| 6115 | Knitting pantyhose, tights, stockings, socks, etc., including stockings for varicose veins and shoes without outer sole |
|
| 6116 | Knitting gloves and mittens |
|
| 6117 | Other knitting apparel & accessories |
Export Quantity & Value for Chinese Knitting Apparel & Accessories from Jan. to June in 2013
| Month | Quantity(-) | Value(Billion USD) | Year on Year | |
|
|
|
| Quantity | Value |
| Jan. | 3,719,409,876 | 8.6 | 9.9% | 24.9% |
| Feb. | 2,479,804,155 | 5.626 | 81.1% | 108.4% |
| March | 2,254,576,389 | 5.223 | -19.9% | -5.3% |
| April | 3,239,217,464 | 7.497 | 11.0% | 32.1% |
| May | 3,489,616,613 | 7.518 | 3.2% | 5.7% |
| June | 3,594,640,307 | 8.126 | 4.7% | 2.9% |
| Total | 18,777,264,804 | 42.589 | 8.6% | 19.0% |
The total export value for Chinese knitting apparel & accessories from Jan. to June in 2013 achieved 42.589 billion USD, and increased 19% year on year.
Major Countries/Regions for Chinese Knitting Apparel & Accessories Export from Jan. to June in 2013
| No. | Countries/Regions | Quantity(-) | Value(Billion USD) | Year on Year | |
|
|
|
|
| Quantity | Value |
| 1 | USA | 2,907,709,928 | 5.797 | 7.5% | 8.3% |
| 2 | Japan | 2,032,673,095 | 4.969 | 1.6% | 2.5% |
| 3 | Hong Kong | 833,024,764 | 3.210 | 14.0% | 44.5% |
| 4 | Vietnam | 633,734,291 | 2.094 | 85.7% | 114.5% |
| 5 | Germany | 852,603,419 | 1.548 | -2.4% | -6.9% |
| 6 | United Arab Emirates | 703,524,882 | 1.511 | -1.1% | 17.3% |
| 7 | United Kingdom | 661,170,489 | 1.499 | 14.4% | 24.5% |
| 8 | Malaysia | 424,818,683 | 1.481 | 15.3% | 89.7% |
| 9 | Russian Federation | 649,870,042 | 1.184 | 38.1% | 34.2% |
| 10 | Australia | 383,550,584 | 1.074 | 7.9% | 12.7% |

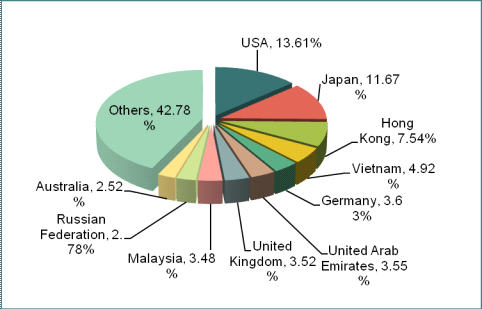
With a total value of 5.8 billion USD, USA ranked first for Chinese knitting apparel & accessories export from Jan. to June in 2013 and increased 8.3% year on year. Japan followed and occupied 11.67% of the export market.
Major Cities/Provinces & Average Unit Price for Chinese Knitting Apparel & Accessories Export from Jan. to June in 2013

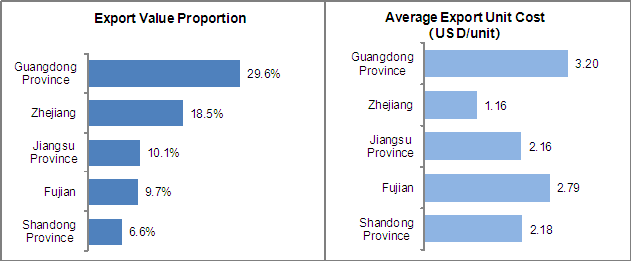
The major cities/provinces for Chinese knitting apparel & accessories export concentrated in Guangdong, Zhejiang and Jiangsu. Respectively Guangdong and Zhejiang occupied 29.6% and 18.5% of the total export value for Chinese knitting apparel & accessories from Jan. to June in 2013.
Source: Customs Information Network


