The Export Analysis of China Electric Tool between Jan. – Jun. 2013
China Electric Tool Export Value and Volume between Jan. – Jun. 2013
| Months | Volume(-) | Value(USD) | Compared with the same period of last year | |
|
|
|
| Volume | Value |
| Jan | 26,317,522 | 695,562,419 | -1% | 6.4% |
| Feb | 19,069,570 | 525,143,029 | 36.6% | 26.7% |
| Mar | 22,791,638 | 664,715,624 | -7.1% | 1.8% |
| Apr | 26,072,910 | 715,846,636 | 3.7% | 10% |
| May | 25,424,889 | 662,786,436 | -2.4% | -0.4% |
| Jun | 24,161,654 | 650,042,426 | -0.8% | 4.6% |
| Total | 143,838,183 | 3,914,096,570 | 2.3% | 7% |
The export value reached $ 3.9 billion during Jan.-Jun. of 2013, which increased 7% as before.
Mainly Export Countries/Regions of China Electric Tool between Jan. - Jun. 2013
| No. | Country | Volume(-) | Value(USD) | Compared with the same period of last year | |
| Volume | Value | ||||
| 1 | USA | 34,985,295 | 1,054,897,932 | -1.7% | 1.1% |
| 2 | Germany | 7,977,581 | 260,110,810 | -8.4% | 1.7% |
| 3 | Russia | 8,579,215 | 249,931,598 | 58.2% | 67.5% |
| 4 | Holland | 4,757,452 | 156,905,037 | 16.2% | 10.2% |
| 5 | UK | 4,857,455 | 138,126,135 | 2.9% | 4.7% |
| 6 | Australia | 3,214,808 | 129,623,721 | 11.4% | 16.9% |
| 7 | Finland | 2,460,942 | 122,024,079 | 46.6% | 40% |
| 8 | Belgium | 4,357,116 | 112,379,832 | 14.1% | 8.4% |
| 9 | Japan | 3,464,743 | 111,057,919 | -1.1% | 7.4% |
| 10 | Brazil | 5,093,170 | 97,891,904 | -15.8% | -0.9% |
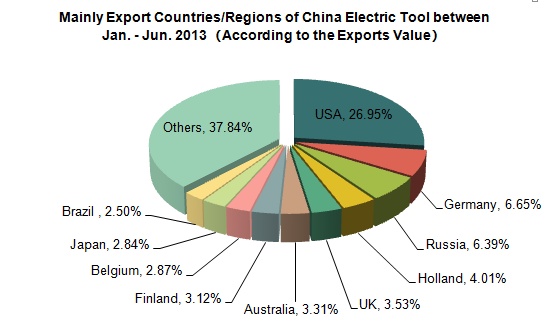
At the top ten export markets of China electric tool between Jan. and Jun. of 2013, Russia took the biggest export volume growth with 58.2%, and Finland is next with 46.6%. Meanwhile, Russia also took the No.1 for export value, which reached 67.5% growth. And Finland is still No.2 with 40%.
Data Source: China Custom


