China Solar Cells Export Volume and Value, from Jan. to Dec. 2013
| Month | Volume (Kg) | Value (USD) | Year-on-Year | ||
| Volume | Value | ||||
| Jan. | 29,206,312 | 883,955,942 | 45% | -16.6% | |
| Feb. | 34,398,736 | 782,299,791 | 81.2% | -14.2% | |
| Mar. | 38,174,352 | 869,613,205 | 61.2% | -37.6% | |
| Apr. | 39,852,236 | 990,078,705 | 44.4% | -39.4% | |
| May | 52,406,766 | 844,891,553 | 35.6% | -54.6% | |
| Jun. | 57,379,099 | 833,588,655 | 34.2% | -28.6% | |
| Jul. | 67,595,447 | 920,769,444 | 55.4% | -17.7% | |
| Aug. | 55,347,381 | 756,309,944 | 45.1% | -17.6% | |
| Sept. | 55,611,725 | 828,927,115 | 110.2% | 6.5% | |
| Oct. | 55,860,331 | 820,277,029 | 120.9% | 30.6% | |
| Nov. | 57,139,708 | 806,853,169 | 101.4% | 17.2% | |
| Dec. | 44,930,338 | 814,269,229 | 39.3% | 28.9% | |
| Total | 587,902,431 | 10,151,833,781 | 60.7% | -20.6% | |
The export volume of Chinese solar cells was 588 million pieces, from Jan. to Dec. 2013, increased 60.7% year on year; the export value was 10.152 billion dollars, decreased 20.6% year on year.
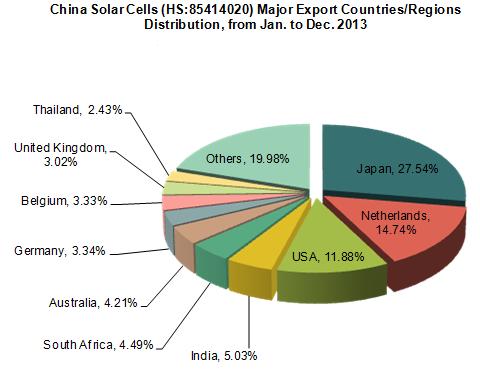
China Solar Cells Major Export Countries/Regions Distribution, from Jan. to Dec. 2013
| No. | Countries/ Regions | Volume (Kg) | Value (USD) | Year-on-Year | ||
| Volume | Value | |||||
| 1 | Japan | 84,216,542 | 2,796,275,424 | 173.4% | 213.1% | |
| 2 | Netherlands | 10,169,796 | 1,496,724,745 | -59.1% | -60.9% | |
| 3 | USA | 39,206,265 | 1,206,182,497 | 91.9% | -14% | |
| 4 | India | 84,168,333 | 510,191,020 | 207.7% | 163.3% | |
| 5 | South Africa | 18,511,573 | 455,704,292 | 811.4% | 1102.5% | |
| 6 | Australia | 3,461,956 | 427,205,283 | -42.3% | -42.4% | |
| 7 | Germany | 32,139,962 | 338,896,307 | -24.4% | -78.6% | |
| 8 | Belgium | 2,101,409 | 338,199,172 | -62.8% | -66% | |
| 9 | United Kingdom | 29,289,914 | 307,069,840 | 118.1% | 46.9% | |
| 10 | Thailand | 1,717,443 | 246,676,761 | -21% | 17.3% | |

The largest export market for Chinese solar cells is Japan. The total export value to Japan was 2.796 billion dollars, from Jan. to Dec. 2013, with an increase of 213.1% year on year. Among the total export value of solar cells, it accounted for 27.54%, followed by Netherlands, which accounted for 17.74%. USA ranked the third place, which accounted for 11.88%.
Among the top ten export countries/ regions, from Jan. to Dec. 2013, the largest increase of volume and value were both in South Africa, increased 811.4% in volume and 1102.5% in value year on year.
China Solar Cells Original Places of Exported Goods, from Jan. to Dec. 2013
| No. | Regions | Volume (Kg) | Value (USD) | Year-on-Year | ||
| Volume | Value | |||||
| 1 | Jiangsu | 433,897,025 | 5,964,543,934 | 89.2% | -22.1% | |
| 2 | Zhejiang | 30,675,041 | 1,086,302,602 | 7.8% | -29.9% | |
| 3 | Shanghai | 10,828,056 | 755,630,173 | -24.7% | -37.9% | |
| 4 | Jiangxi | 9,418,435 | 640,251,366 | 16.4% | 26.6% | |
| 5 | Tianjin | 2,612,768 | 476,259,946 | 72.8% | 33.3% | |
| 6 | Guangdong | 13,348,039 | 344,972,912 | -9.7% | -25.9% | |
| 7 | Liaoning | 12,939,143 | 174,996,589 | -17.6% | 297.5% | |
| 8 | Shandong | 1,702,205 | 160,023,296 | -47.2% | -45.9% | |
| 9 | Hebei | 35,973,424 | 151,135,373 | 35.5% | -17.1% | |
| 10 | Henan | 1,824,503 | 145,623,451 | 42.5% | 4.6% | |
The major solar cells original places in China are Jiangsu and Zhejiang. From Jan. to Dec. 2013, the export volume of the above two provinces accounted for 79.02% of the total export volume, and the export value of the two provinces accounted for 69.45% of the total export value. Among them, the largest increase of export volume was in Jiangsu, increased 89.2% year on year; the largest increase of export value was in Liaoning, increased 297.5% year on year.


