2009-2011 Global Blow Molding Machines Import Value
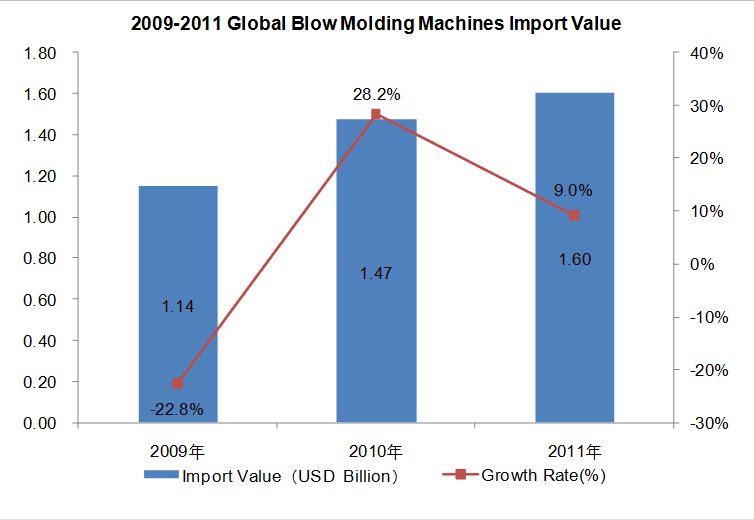
In the year between 2009 and 2011, Global blow molding machines import value increased year by year. The total import value of 2011 was 1.6 billion dollars, up 9.0% year on year, but its growth rate fell down compared to 2010.
Major Global Blow Molding Machines Importers from 2009 to 2011
| No. | Countries/Regions | Import Value(US Dollar Million) | Amount in 2011 Compared with 2009 | ||
| 2009 | 2010 | 2011 | |||
| 1 | China | 179.3 | 301.5 | 268.2 | 149.55% |
| 2 | USA | 99.5 | 122.3 | 156.1 | 156.90% |
| 3 | Indonesia | 25.5 | 41.9 | 71.9 | 282.10% |
| 4 | Mexico | 42.1 | 57.5 | 69.6 | 165.51% |
| 5 | Japan | 31.5 | 43.6 | 68.7 | 217.92% |
| 6 | Brazil | 37.9 | 53.8 | 61.9 | 163.17% |
| 7 | Thailand | 29.0 | 51.9 | 58.4 | 201.17% |
| 8 | Saudi Arabia | 0.0 | 24.3 | 49.7 | / |
| 9 | Austria | 43.0 | 40.3 | 44.0 | 102.31% |
| 10 | Russian Federation | 10.0 | 24.2 | 38.2 | 382.28% |
| 11 | Germany | 19.4 | 19.6 | 35.0 | 180.08% |
| 12 | France | 26.0 | 47.4 | 33.2 | 127.62% |
| 13 | South Korea | 17.4 | 25.2 | 29.8 | 171.81% |
| 14 | India | 23.7 | 36.3 | 29.7 | 125.37% |
| 15 | Malaysia | 19.1 | 22.0 | 27.0 | 141.28% |
| 16 | Argentina | 8.9 | 14.5 | 26.8 | 303.15% |
| 17 | South Africa | 11.3 | 16.8 | 23.9 | 210.74% |
| 18 | Italy | 34.0 | 36.7 | 23.2 | 68.26% |
| 19 | Poland | 15.7 | 21.9 | 21.9 | 139.62% |
| 20 | Vietnam | 16.5 | 19.3 | 21.2 | 128.52% |
China is the largest importer of the blow molding machines, and the import value reached 268 million dollars in 2011, accounting for 16.77% of the total global import value. Followed by the USA, its import value was up to 156 million dollars in 2011, occupied 9.76% of the total global import value. Among the top 20 countries and regions mentioned above, in comparison with 2009, the three largest increased countries and regions in 2011 were Russian Federation (up 382.28%), Argentina (a rise of 303.15%) and Indonesia (an increased by 282.10%); meanwhile, the top three countries and regions with largest increase of import value in 2011 were as follows: China (a rise of 0.89 billon dollars), USA (an increased by 0.57 billon dollars) and Saudi Arabia (up 0.50 billon dollars).
The Market Share of Major Global Blow Molding Machines Importers from 2009 to 2011
| No. | Countries/Regions | Proportion of Import Value (%) | ||
| 2009 | 2010 | 2011 | ||
| 1 | China | 15.67% | 20.55% | 16.77% |
| 2 | USA | 8.69% | 8.33% | 9.76% |
| 3 | Indonesia↑ | 2.23% | 2.86% | 4.50% |
| 4 | Mexico↑ | 3.67% | 3.92% | 4.35% |
| 5 | Japan↑ | 2.76% | 2.97% | 4.30% |
| 6 | Brazil↑ | 3.31% | 3.67% | 3.87% |
| 7 | Thailand↑ | 2.53% | 3.54% | 3.65% |
| 8 | Saudi Arabia↑ | 0 | 1.66% | 3.11% |
| 9 | Austria | 3.76% | 2.74% | 2.75% |
| 10 | Russian Federation↑ | 0.87% | 1.65% | 2.39% |
| 11 | Germany | 1.70% | 1.34% | 2.19% |
| 12 | France | 2.27% | 3.23% | 2.08% |
| 13 | South Korea↑ | 1.52% | 1.72% | 1.86% |
| 14 | India | 2.07% | 2.47% | 1.86% |
| 15 | Malaysia | 1.67% | 1.50% | 1.69% |
| 16 | Argentina↑ | 0.77% | 0.99% | 1.68% |
| 17 | South Africa↑ | 0.99% | 1.14% | 1.49% |
| 18 | Italy↓ | 2.97% | 2.50% | 1.45% |
| 19 | Poland | 1.37% | 1.49% | 1.37% |
| 20 | Vietnam | 1.44% | 1.32% | 1.32% |
Note: “↑” indicates that the proportion covered by import value in the total global import value grew continuously from 2009 to 2011. “↓” shows that the proportion covered by import value in the total global import value declined continuously from 2009 to 2011.
According to the table, the countries and regions which proportion covered by import value in the total global import value grew continuously from 2009 to 2011 were as follows: Indonesia, Mexico, Japan, Brazil, Thailand, Saudi Arabia, Russian Federation, South Korea, Argentina and South Africa. Among all the countries and regions mentioned above, Saudi Arabia grew the most sharply, which was up 3.11% in 2011 compared to 2009. Italy was the country which proportion covered by import value in the total global import value declined continuously, with a drop of 1.52% in 2011 in comparison with 2009.


