The Import Value Trend of Global Headgear and Parts Thereof between 2010-2012
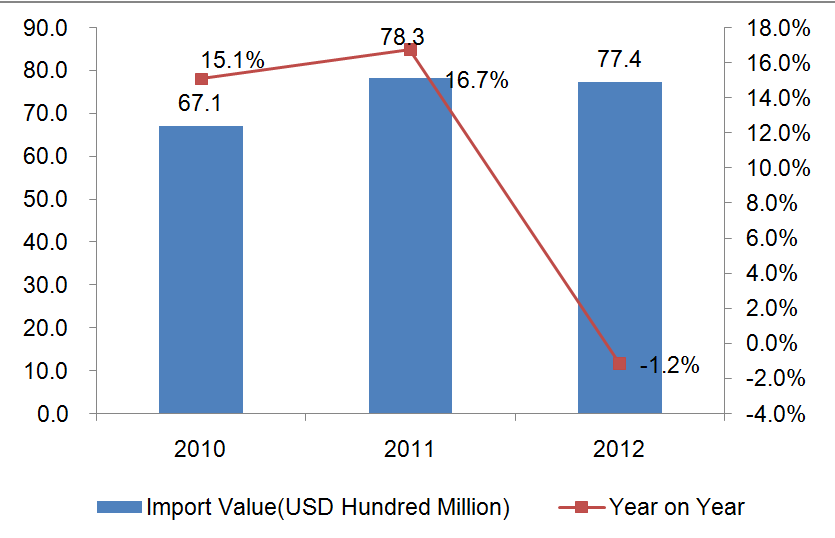
During 2010-2012, the import value trend of global headgear and parts thereof like a opposite "V", the import value reached 7.74 billion dollars at 2010,which dropped 1.2% than before.
The Import Value Increasing Analysis for Mainly Import Countries/Regions of Headgear and Parts Thereof between 2010-2012
| No. | Import Countries/Regions | Import Value(hundred million Dollars) | 2012 Import Value Growth compared 2010 | ||
| 2010 | 2011 | 2012 | |||
| 1 | USA | 17.6 | 21.1 | 20.9 | 18.2% |
| 2 | Germany | 5.7 | 6.3 | 5.6 | -1.1% |
| 3 | Japan | 4.2 | 5.1 | 5.4 | 27.4% |
| 4 | UK | 3.8 | 4.4 | 4.2 | 10.8% |
| 5 | France | 4.1 | 4.6 | 4.1 | -0.5% |
| 6 | Canada | 2.6 | 3.0 | 3.1 | 15.8% |
| 7 | Italy | 2.8 | 3.1 | 2.5 | -12.8% |
| 8 | Russia | 1.2 | 1.6 | 2.1 | 80.9% |
| 9 | Holland | 1.3 | 1.9 | 1.8 | 35.0% |
| 10 | Australia | 1.3 | 1.6 | 1.8 | 32.1% |
As the biggest import country of global headgear and parts thereof, 2012 USA import value increased 18.2% compared with 2010, Germany and Japan listed No.2 and No.3. At top ten import countries, Russia took a obvious import value growth 2012, which increased 80.9% compared with 2010.
The Marketing Share Trends for Mainly Import Countries/Regions of Headgear and Parts Thereof between 2010-2012
| No. | Import Countries/Regions | Proportion | ||
| 2010 | 2011 | 2012 | ||
| 1 | USA↑ | 26.31% | 26.89% | 26.96% |
| 2 | Germany↓ | 8.48% | 8.06% | 7.26% |
| 3 | Japan↑ | 6.27% | 6.55% | 6.93% |
| 4 | UK↓ | 5.67% | 5.62% | 5.45% |
| 5 | France↓ | 6.10% | 5.86% | 5.27% |
| 6 | Canada | 3.93% | 3.86% | 3.95% |
| 7 | Italy↓ | 4.20% | 3.92% | 3.17% |
| 8 | Russia↑ | 1.74% | 1.99% | 2.73% |
| 9 | Netherlands | 2.00% | 2.47% | 2.34% |
| 10 | Australia↑ | 2.00% | 2.03% | 2.29% |
Note:↑means the index keeps increasing between 2010-2012,↓means the index keeps dropping between 2010-2012
The countries of import value marketing share, which keep increasing, include USA, Japan, Russia and Australia. And opposite countries include Germany, UK, France and Italy.
The Mainly Import Countries/Regions of Headgear and Parts Thereof between Jan-Apr.2013
| No. | Import Country/Region | Import Value (thousand Dollars) | Compared with the same period of last year |
| 1 | USA | 599,512 | -3.49% |
| 2 | Japan | 203,359 | -3.41% |
| 3 | Germany | 171,404 | -5.41% |
| 4 | France | 130,510 | -6.93% |
| 5 | UK | 111,108 | -3.23% |
| 6 | Italy | 70,528 | -17.39% |
| 7 | Canada | 69,972 | -22.84% |
| 8 | Netherlands | 65,175 | -2.08% |
| 9 | Australia | 55,539 | 4.89% |
| 10 | Russia | 52,489 | 3.99% |
Data Source:UN Comtrade


