Export Quantity & Value for Chinese Bamboo Floor from Jan. to Sep. in 2013
| Month | Quantity (KG) | Value (USD) | Year on Year | |
|
|
|
| Quantity | Value |
| Jan. | 16,598,241 | 34,857,491 | 4.5% | 27.8% |
| Feb. | 9,396,899 | 18,344,472 | 0 | 5.8% |
| March | 11,011,282 | 20,377,495 | -33.2% | -31.9% |
| April | 13,170,199 | 24,076,847 | -12% | -15.3% |
| May | 16,527,167 | 28,440,737 | -9.7% | -22.8% |
| June | 17,429,693 | 29,244,451 | 28% | 6.7% |
| July | 16,374,787 | 29,300,537 | 29.3% | 17.1% |
| August | 13,900,533 | 24,907,933 | 13.6% | -4.9% |
| Sep. | 14,175,404 | 25,531,176 | 19.5% | 3.6% |
| Total | 128,584,205 | 235,081,139 | 2.5% | -3.3% |
The total export quantity for Chinese bamboo floor from Jan. to Sep. in 2013 achieved 12.86 million KG, and increased 2.5% year on year. The total export value was 235 million USD, and declined 3.3% year on year.
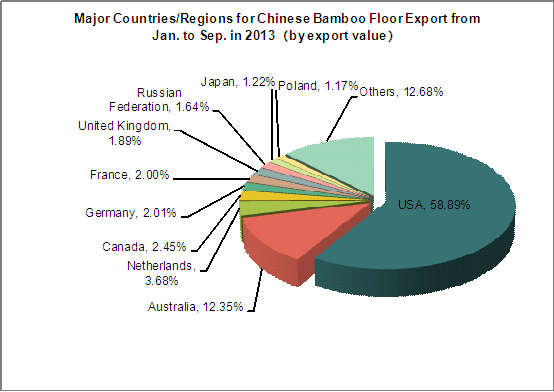
Major Countries/Regions for Chinese Bamboo Floor Export from Jan. to Sep. in 2013
| No. | Countries/Regions | Quantity (KG) | Value (USD) | Year on Year | |
|
|
|
|
| Quantity | Value |
| 1 | USA | 71,844,231 | 138,447,844 | 24.4% | 13.7% |
| 2 | Australia | 18,804,508 | 29,033,409 | 9.3% | 2.5% |
| 3 | Netherlands | 4,464,493 | 8,662,318 | -9.3% | -1% |
| 4 | Canada | 3,272,435 | 5,769,017 | -59.9% | -59.4% |
| 5 | Germany | 2,921,274 | 4,730,317 | -24.4% | -21.3% |
| 6 | France | 2,713,893 | 4,702,073 | -11.1% | -4.7% |
| 7 | United Kingdom | 2,548,397 | 4,439,658 | -26.2% | -20.2% |
| 8 | Russian Federation | 1,622,398 | 3,861,671 | -6% | -4% |
| 9 | Japan | 1,375,661 | 2,876,790 | 14.3% | 8.1% |
| 10 | Poland | 1,708,158 | 2,751,902 | -19.9% | -19.4% |

The major countries/regions for Chinese bamboo floor export from Jan. to Sep. in 2013 were USA and Australia, which occupied 58.89% and 12.35% respectively (71.24% in total) of the total export value. With an export value of 138 million USD, USA ranked first of the top 10 countries/regions for Chinese bamboo floor export from Jan. to Sep. in 2013 and increased 13.7% year on year.
Source: Customs Information Network


