| No. | Countries/Regions | Jan. to August Total | Year on Year | ||
|
|
| Volume (Piece) | Value (USD) | Volume | Value |
| 1 | Ethiopia | 3,415 | 77,055,066 | 42.3% | 86.6% |
| 2 | Nigeria | 2,050 | 70,777,430 | 9.5% | 8.4% |
| 3 | Thailand | 1,749 | 45,270,948 | -17.8% | -9.2% |
| 4 | Algeria | 2,614 | 44,526,131 | -10.6% | -7.7% |
| 5 | Malaysia | 1,608 | 44,208,253 | 20.5% | 76% |
| 6 | The Russian Federation | 8,439 | 34,092,918 | 1.4% | -52.7% |
| 7 | Ukraine | 24,952 | 33,544,618 | 124.8% | 21.8% |
| 8 | Tanzania | 1,010 | 28,130,815 | 47.4% | 114.6% |
| 9 | Myanmar | 4,619 | 26,095,638 | 98.5% | -46.1% |
| 10 | Angola | 644 | 23,944,606 | -7.5% | 9.1% |

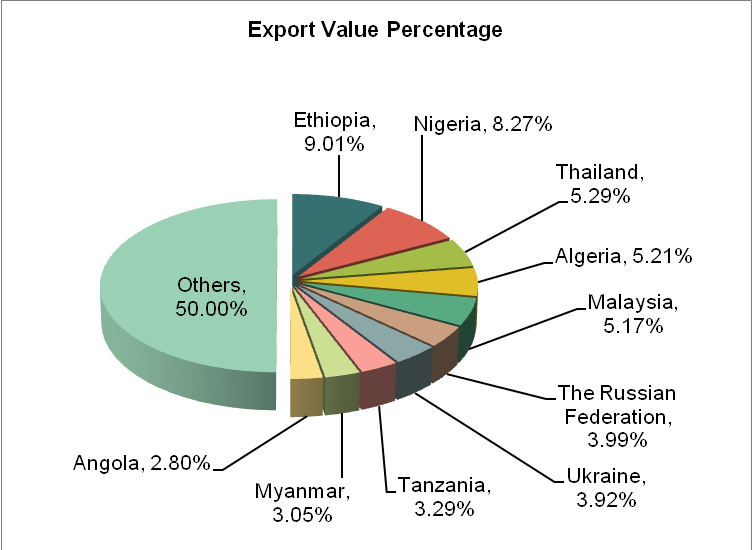
Our country's tractors (other than tractors of heading No. 8709) export value amounted to about 855 million US dollars from Jan. to August in 2013, with a decrease of 18.3% year on year. Main export countries/regions are Ethiopia, Nigeria, Thailand, Algeria, Malaysia, The Russian Federation, Ukraine, Tanzania, Myanmar, and Angola and so on, and export markets are concentrated in the developing countries. Ethiopia is China tractors (other than tractors of heading No. 8709)'s key export market. The export value to Ethiopia accounted about 9.01% of the total export value of the product, and the export markets are relatively decentralized. From Jan. to August in 2013, China export value to Tanzania grew the fastest year on year, which increased by 114.6%.
Source: Customs Information Network


