2011-2013 China Computer Industry Export Volume Trend Analysis
2011-2013 China Export Quantity Annual Trend
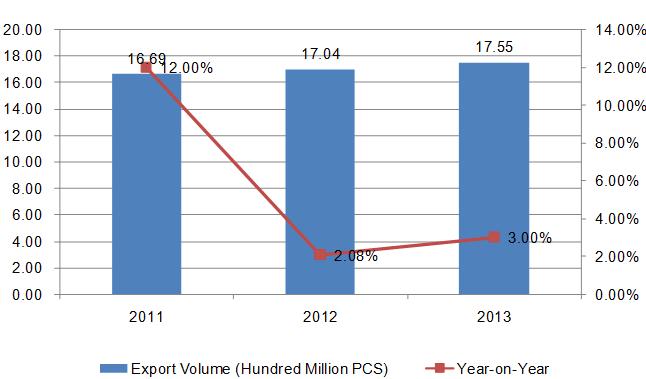
2011-2013 China Computer export volume has a sustainable growth, the export volumes of the three year are 16.69 hundred million PCS, 17.04hundred million PCS and 17.55 hundred million PCS, which increased by 12%, 2.08% and 3% year-on-year.
2011-2013 China Computer Industry Export Quantity Monthly Trend
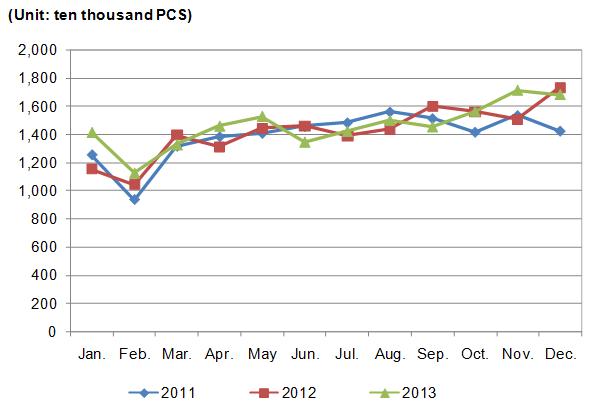
As can be seen from the above chart, China Computer's export low ebb is usually around Feb. per year; peak times are during Nov. to Dec.
2011-2013 China Computer Industry Export Value Trend Analysis
2011-2013 Computer Industry Export Value Trend
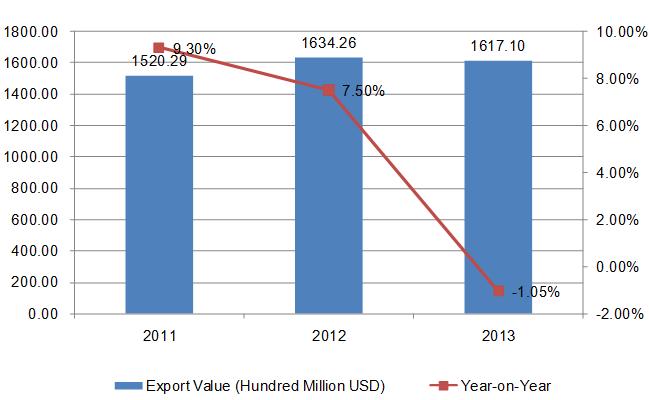
2011-2013 China Computer export values are 152.029 billion US dollars, 163.426 billion US dollars and 161.71 billion US dollars.
2011-2013 Computer Industry Export Value Trend
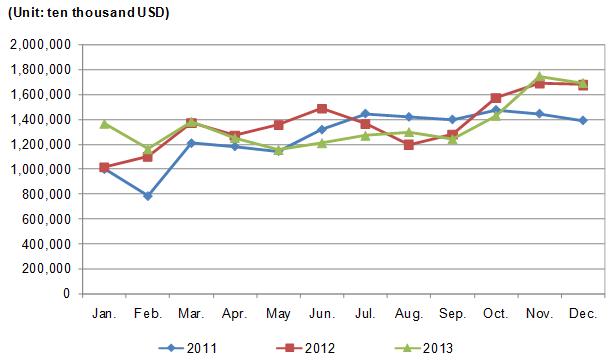
As can be seen from the above chart, China Computer's export value low ebb is usually around Feb., peak time is during Jan.
2011-2013 China Computer Industry Export Average Unit Price Trend Analysis
2011-2013 Computer Industry Export Average Unit Price Annual Trend
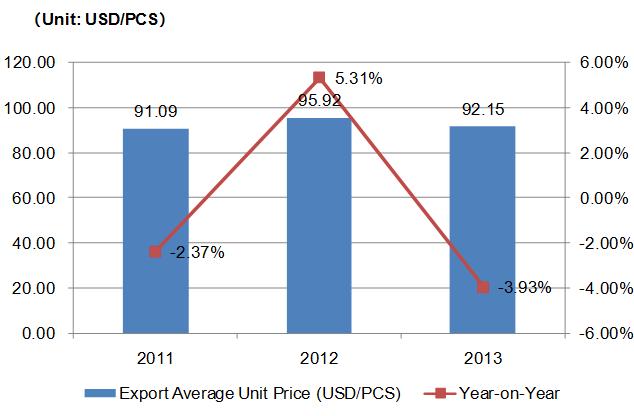
2013 China Computer export average price is 92.15 USD/PCS, which declined 3.93% year-on-year.
2011-2013 China Computer Industry Export Country Trend Analysis
2011-2013 China Computer Industry Export Market Trend
| No. | Countries/ Regions | Export Value (USD) | Growth in 2013 compared with 2011 | ||
| 2011 | 2012 | 2013 | |||
| 1 | USA | 48,719,733,115 | 50,316,296,240 | 49,677,415,122 | 1.97% |
| 2 | Hong Kong | 24,620,925,922 | 31,513,364,593 | 30,824,987,440 | 25.20% |
| 3 | Netherlands | 13,947,684,525 | 13,875,462,976 | 15,018,883,736 | 7.68% |
| 4 | Japan | 8,568,905,424 | 9,458,079,090 | 9,448,010,903 | 10.26% |
| 5 | Germany | 8,085,284,357 | 9,116,509,469 | 7,807,743,060 | -3.43% |
| 6 | United Kingdom | 3,403,122,533 | 4,333,132,572 | 4,658,349,735 | 36.88% |
| 7 | Singapore | 3,316,982,182 | 3,654,703,743 | 3,720,074,200 | 12.15% |
| 8 | Republic of Korea | 3,408,857,719 | 3,144,900,196 | 3,356,618,339 | -1.53% |
| 9 | Australia | 3,407,695,055 | 3,053,458,329 | 3,209,600,218 | -5.81% |
| 10 | UAE | 2,516,760,720 | 2,976,427,615 | 2,748,405,686 | 9.20% |
2013 China Computer first three export markets are USA, Hong Kong and Netherlands, the export values to them accounted for 30.72%, 19.06% and 9.29% of the total export value, total nearly 6 percent. USA, Hong Kong and Netherlands are also the computer global main demand markets.
2011-2013 China Computer Industry Export Market Share Trend
| No. | Countries/ Regions | Export Value Share | ||
| 2011 | 2012 | 2013 | ||
| 1 | USA↓ | 32.05% | 30.79% | 30.72% |
| 2 | Hong Kong | 16.19% | 19.28% | 19.06% |
| 3 | Netherlands | 9.17% | 8.49% | 9.29% |
| 4 | Japan↑ | 5.64% | 5.79% | 5.84% |
| 5 | Germany | 5.32% | 5.58% | 4.83% |
| 6 | United Kingdom↑ | 2.24% | 2.65% | 2.88% |
| 7 | Singapore↑ | 2.18% | 2.24% | 2.30% |
| 8 | Republic of Korea | 2.24% | 1.92% | 2.08% |
| 9 | Australia | 2.24% | 1.87% | 1.98% |
Note: “↑”represents that the indicators listed, continued to increase from 2011 to 2013, “↓”represents that the indicators listed, continued to decrease from 2011 to 2013.
Judging from the export value share, the proportion of export value for Japan, United Kingdom and Singapore continued to rise, while that of the USA continued to decline.
Source: China Customs


