Jan. to Sep. 2014, China Ionic-Beam Arc Processes, Water-Jet Cutting Machines (HS: 8456) Major Export Countries/Regions Distribution (Sort by Export Value)
| NO. | Countries/Regions | Jan. - Sep. | Compared to the same period last year | ||
| Volume | Value(USD) | Volume | Value | ||
| 1 | USA | 27,147 | 48,499,604 | 14.2% | 6.7% |
| 2 | Hong Kong | 2,257 | 44,298,142 | 0.8% | 96.7% |
| 3 | India | 3,523 | 23,571,248 | 12.8% | 40.2% |
| 4 | Japan | 2,237 | 20,256,303 | -29.9% | 26.6% |
| 5 | Germany | 4,364 | 19,592,927 | 35.9% | 3.8% |
| 6 | Republic of Korea | 1,266 | 19,096,695 | -2.8% | -26.1% |
| 7 | Vietnam | 2,778 | 17,970,421 | -11.6% | -39.4% |
| 8 | Brazil | 3,767 | 15,880,990 | -42% | -6.7% |
| 9 | Thailand | 4,583 | 14,926,398 | 11.9% | 16.4% |
| 10 | Taiwan | 982 | 14,452,017 | 25.7% | 31.2% |
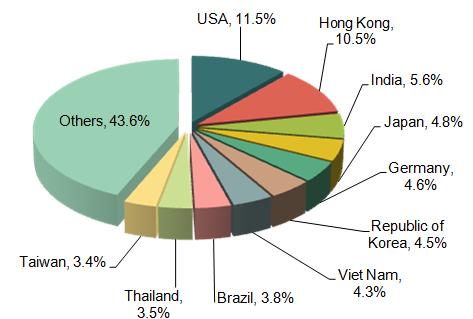
From January to September in 2014, China's main original export countries/regions of ionic-beam arc processes, water-jet cutting machines are Hong Kong, India, Germany, Japan, Korea Vietnam, Brazil, Thailand and Taiwan, etc. The United States and Hong Kong is China's ion arc processing machine tools and water jet cutting machine's main export markets, accounting for 11.5% and 10.5% of the total amount of such products. From January to September in 2014, in China's top ten major ion arc processing machine tools and water jet cutting machine export market, export amount of Hong Kong rose 96.7% at the fastest increasing speed
Jan. to Sep. 2014, China Machining Centres, Unit Construction Machines (HS: 8457) Major Export Countries/Regions Distribution (Sort by Export Value)
| NO. | Countries/Regions | Jan.-Sep. | Compared to the same period last year | ||
| Volume | Value(USD) | Volume | Value | ||
| 1 | Hong Kong | 238 | 14,437,441 | -23.5% | 38.2% |
| 2 | USA | 308 | 13,450,163 | -12.7% | 5.3% |
| 3 | India | 266 | 11,698,070 | -7% | 110.2% |
| 4 | Japan | 206 | 11,309,251 | 14.4% | -3% |
| 5 | Germany | 108 | 10,141,004 | -65% | -10.4% |
| 6 | Republic of Korea | 154 | 6,270,290 | -54.2% | 30.1% |
| 7 | Netherlands | 39 | 5,701,663 | -15.2% | 20.9% |
| 8 | Iran | 180 | 5,038,279 | 650% | 552.6% |
| 9 | Republic of Korea | 93 | 4,957,880 | 121.4% | 73.5% |
| 10 | Pakistan | 291 | 4,517,323 | -51.7% | 1952.9% |
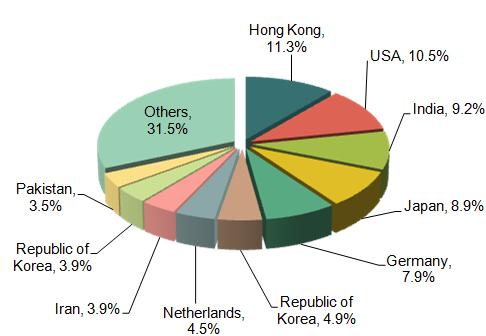
From January to September in 2014, China's main original export countries/regions of Machining centres, unit construction machines are Hong Kong India Japan Germany Russia's federal Dutch Iran South Korea and Pakistan etc. The United States and Hong Kong is China's Machining centres, unit construction machines’s main export markets, accounting for 11.3% and 10.5% of the total amount of such products. From January to September in 2014, in China's top ten major Machining centres, unit construction machines, export amount of India, Iran and Pakistan rose 10.2%, 552.6% and 1952.9%, at the fast increasing speed.
Jan. to Sep. 2014, China Lathes for Removing Metal (HS: 8458) Major Export Countries/Regions Distribution (Sort by Export Value)
| NO. | Countries/Regions | Jan.-Sep. | Compared to the same period last year | ||
| Volume | Value(USD) | Volume | Value | ||
| 1 | Japan | 3,765 | 88,842,473 | 48.6% | 59.4% |
| 2 | USA | 9,772 | 33,415,136 | -6.8% | 10.9% |
| 3 | Germany | 5,945 | 32,619,781 | 20.3% | 26.5% |
| 4 | Netherlands | 976 | 17,654,203 | 19.8% | 35.2% |
| 5 | Indonesia | 2,027 | 14,441,022 | -14.5% | -22.5% |
| 6 | Thailand | 956 | 14,410,170 | -5.7% | -1% |
| 7 | Russian Federation | 2,950 | 13,869,360 | -33.4% | -23.8% |
| 8 | India | 739 | 12,568,995 | -13.4% | 14.5% |
| 9 | Turkey | 895 | 11,032,543 | 15% | 84.2% |
| 10 | Taiwan | 527 | 10,437,413 | 53.2% | 41.7% |
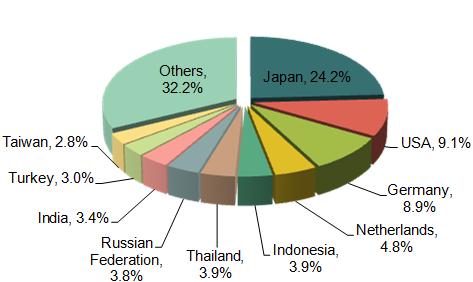
Japan 24.2%, USA 9.1%, Germany 8.9%, and Netherlands 4.8%, Indonesia 3.9%,
From January to September in 2014, China's main original export countries/regions of Lathes for removing metal are Japan, America, Germany, Netherlands, Indonesia, Thailand, Russia federal, India, Turkey and Taiwan, etc. Japan is China's Lathes for removing metal’s main export markets, accounting for 24.2% of the total amount of such products.
Jan. to Sep. 2014, China Machine-tools for Removing Metal (HS: 8459) Major Export Countries/Regions Distribution (Sort by Export Value)
| NO. | Countries/Regions | Jan.-Sep. | Compared to the same period last year | ||
| Volume | Value(USD) | Volume | Value | ||
| 1 | Vietnam | 8,536 | 83,318,109 | -30.6% | 2669.7% |
| 2 | USA | 198,257 | 29,648,071 | -3.3% | 4.9% |
| 3 | Germany | 59,553 | 15,609,895 | 24.1% | 2.7% |
| 4 | India | 4,448 | 14,034,056 | 3.5% | 89.8% |
| 5 | Russian Federation | 29,570 | 11,549,794 | -2.6% | 18% |
| 6 | Indonesia | 29,539 | 9,261,555 | -37% | -7.5% |
| 7 | Turkey | 9,998 | 7,533,019 | 22.9% | 33.3% |
| 8 | United Kingdom | 29,180 | 7,300,477 | 38.3% | 36.9% |
| 9 | Brazil | 29,366 | 5,748,933 | -49.9% | -42.7% |
| 10 | Iran | 4,528 | 5,352,315 | 518.6% | 506.9% |
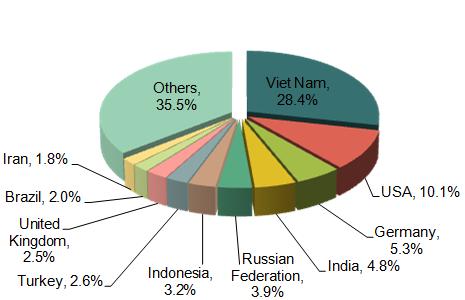
From January to September in 2014, China's main original export countries/regions of Machine-tools for removing metal (except product 8458) are Vietnam, America, India, Russia, German, Indonesia, Turkey, British ,Brazil and Iran etc. Vietnam is China's Machine-tools for removing metal (except product 8458)'s main export markets, increasing by 2669.7%, accounting for 28.4% from January to September in 2014.
Jan. to Sep. 2014, China Machine-tools for Sharpening Metal (HS: 8460) Major Export Countries/Regions Distribution (Sort by Export Value)
| NO. | Countries/Regions | Jan.-Sep. | Compared to the same period last year | ||
| Volume | Value(USD) | Volume | Value | ||
| 1 | USA | 558,520 | 21,436,655 | 16.4% | 0.3% |
| 2 | Vietnam | 38,027 | 16,828,382 | 15.9% | 76.4% |
| 3 | Germany | 264,791 | 15,817,341 | 36.5% | -2.1% |
| 4 | Russian Federation | 343,915 | 12,486,664 | -9.4% | 4.2% |
| 5 | India | 21,553 | 10,978,134 | 9.8% | -9.4% |
| 6 | Latvia | 16,150 | 7,959,279 | -69.1% | 554.2% |
| 7 | Taiwan | 16,273 | 7,547,228 | 267.2% | 31.5% |
| 8 | Indonesia | 70,799 | 5,997,357 | 113.4% | 29.4% |
| 9 | Malaysia | 17,424 | 5,135,560 | 91.7% | 35.3% |
| 10 | Brazil | 149,765 | 4,802,126 | -37.7% | -37.4% |
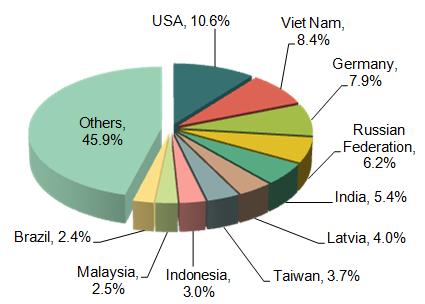
From January to September in 2014, China's main original export countries/regions of Machine-tools for sharpening metal are America, Vietnam Germany Russia federal Indian Latvia Taiwan, Indonesia, Malaysia and Brazil, etc. America is China's Machine-tools for sharpening metal's main export markets, accounting for 10.6% of the total amount of such products. From January to September in 2014, in China's top ten major Machine-tools for sharpening metal market, export amount of Latvia rose 554.2%, at the fastest increasing speed.
Jan. to Sep. 2014, China Machine-tools for Slotting Metal (HS: 8461) Major Export Countries/Regions Distribution (Sort by Export Value)
| NO. | Countries/Regions | Jan.-Sep. | Compared to the same period last year | ||
| Volume(-) | Value(USD) | Volume | Value | ||
| 1 | Vietnam | 142,875 | 32,942,200 | 95.1% | 364.7% |
| 2 | USA | 181,340 | 17,854,760 | -19.7% | -19.6% |
| 3 | India | 182,491 | 14,323,626 | 33.7% | 12.2% |
| 4 | Thailand | 157,936 | 13,206,712 | -14.2% | -4.3% |
| 5 | Japan | 47,730 | 8,494,576 | 27.3% | 80.3% |
| 6 | Germany | 49,555 | 7,163,853 | 4.9% | 11.1% |
| 7 | Republic of Korea | 20,831 | 6,808,264 | 71.5% | 124.3% |
| 8 | Indonesia | 60,745 | 6,603,239 | 9.1% | -3.1% |
| 9 | United Kingdom | 72,253 | 6,495,727 | 37.4% | 55.1% |
| 10 | Malaysia | 26,067 | 6,419,505 | -5.4% | 26.9% |
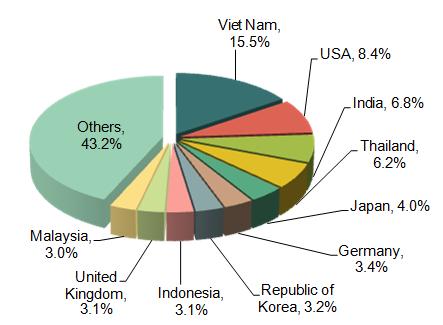
From January to September in 2014, China's main original export countries/regions of Machine-tools for slotting metal are Vietnam, Japan, America, Germany, Netherlands, Indonesia, Thailand, Russia federal, India, Turkey and Taiwan, etc. The export amount of Vietnam increased by 364.7%,compared to the same period last year, becoming the biggest China's Machine-tools for slotting metal 's main export markets, accounting for 15.5% of the total amount.
Jan. to Sep. 2014, China Machine-tools for Forging, Hammering (HS: 8462) Major Export Countries/Regions Distribution (Sort by Export Value)
| NO. | Countries/Regions | Jan.-Sep. | Compared to the same period last year | ||
| Volume | Value(USD) | Volume | Value | ||
| 1 | India | 2,764 | 54,565,802 | 22.6% | 85.7% |
| 2 | USA | 121,123 | 52,400,348 | 31.9% | -45.3% |
| 3 | Indonesia | 4,997 | 42,157,136 | -7% | 60.2% |
| 4 | Thailand | 2,570 | 37,373,869 | -20.6% | 23.9% |
| 5 | Russian Federation | 25,786 | 36,867,471 | 13.6% | 3.3% |
| 6 | Vietnam | 2,944 | 36,605,470 | 108.4% | 68.2% |
| 7 | Malaysia | 16,351 | 36,415,579 | 416.5% | 94.2% |
| 8 | United Kingdom | 19,810 | 27,626,776 | 83% | 486.3% |
| 9 | Brazil | 2,019 | 18,909,705 | 12.2% | -48.4% |
| 10 | Japan | 6,497 | 15,926,313 | 69.6% | 18.6% |
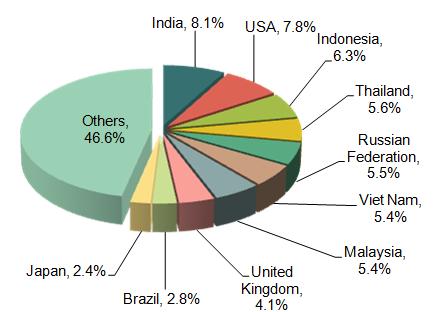
From January to September in 2014, China's main original export countries/regions of Machine-tools for forging, hammering are India, America, Indonesia, Thailand, Russia federal, Vietnam, Japan, Malaysia, England, Brazil, Japan etc. Indian is China's Machine-tools for forging, hammering’s main export markets, accounting for 8.1% of the total amount of such products. The export market of China's Machine-tools for forging, hammering is divided.
Jan. to Sep. 2014, China Machine-tools for Working Metal or Cermets (HS: 8463) Major Export Countries/Regions Distribution (Sort by Export Value)
| NO. | Countries/Regions | Jan.-Sep. | Compared to the same period last year | ||
| Volume | Value(USD) | Volume | Value | ||
| 1 | Vietnam | 2,258 | 16,717,724 | 135.7% | 167% |
| 2 | India | 811 | 15,669,093 | -4.8% | 1.1% |
| 3 | Brazil | 832 | 10,098,191 | 1.2% | 139.9% |
| 4 | Russian Federation | 504 | 9,870,606 | 17.8% | 38.3% |
| 5 | Indonesia | 664 | 7,738,217 | -36.2% | -14.1% |
| 6 | Malaysia | 587 | 6,869,388 | -2.5% | 44.2% |
| 7 | Turkey | 280 | 6,408,850 | -45.7% | 26.5% |
| 8 | USA | 167 | 5,989,170 | -47% | -33.7% |
| 9 | Iran | 392 | 4,690,381 | 37.1% | 56.4% |
| 10 | Taiwan | 274 | 3,889,185 | -3.5% | 25.3% |
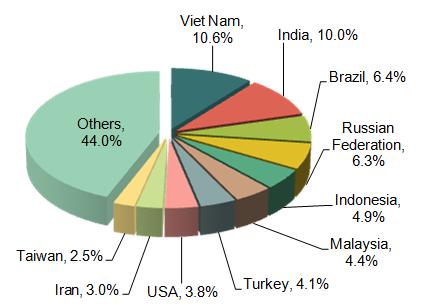
From January to September in 2014, China's main original export countries/regions of Machine-tools for working metal or cermets are Vietnam India Brazil of the Russian federation Indonesia Malaysia Iran and Taiwan in the Turkey, America, Iran and Taiwan etc. Vietnam is China's Machine-tools for working metal or cermets 's main export markets, accounting for 10.6% of the total amount of such products. The export market of China's Machine-tools for working metal or cermets mainly concentrated in the Asian region.
Jan. to Sep. 2014, China Machine-tools for Mineral Materials or for Cold Working Glass (HS: 8464) Major Export Countries/Regions Distribution (Sort by Export Value)
| NO. | Countries/Regions | Jan.-Sep. | Compared to the same period last year | ||
| Volume | Value(USD) | Volume | Value | ||
| 1 | Vietnam | 19,469 | 68,016,394 | -56.4% | -40.2% |
| 2 | USA | 465,341 | 36,971,494 | -20.8% | 0% |
| 3 | India | 69,932 | 33,454,172 | -25.9% | -4.2% |
| 4 | Egypt | 9,690 | 22,334,439 | -14.5% | 19.4% |
| 5 | Russian Federation | 343,373 | 20,846,029 | 12.7% | -13.7% |
| 6 | Brazil | 34,622 | 16,098,024 | -33.7% | 29.1% |
| 7 | Malaysia | 24,882 | 12,068,529 | -14.3% | -17.9% |
| 8 | Turkey | 5,576 | 11,701,863 | -23.4% | -10.9% |
| 9 | Indonesia | 16,392 | 11,048,983 | 4.2% | -16.3% |
| 10 | Iran | 10,147 | 9,421,287 | 31.3% | 83.5% |
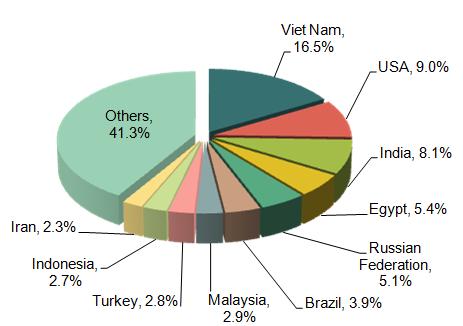
From January to September in 2014, China's main original export countries/regions of Machine-tools for mineral materials or for cold working glass are Vietnam, America, India, Egypt, Russian federal, Brazil, Malaysia, Turkey, Indonesia, Iran etc. From January to September in 2014, Vietnam is China's Machine-tools for working metal or cermets 's main export markets, accounting for 16.5% of the total amount of such products.
Jan. to Sep. 2014, China Machine-tools for Working Wood, Hard Plastics or Similar Hard Materials (HS: 8465) Major Export Countries/Regions Distribution (Sort by Export Value)
| NO. | Countries/Regions | Jan.-Sep. | Compared to the same period last year | ||
| Volume | Value(USD) | Volume | Value | ||
| 1 | Vietnam | 77,834 | 410,795,885 | 359.4% | 2487% |
| 2 | USA | 1,742,248 | 206,933,476 | 25.7% | 32.2% |
| 3 | Germany | 840,014 | 98,785,436 | 19.1% | 18.6% |
| 4 | Russian Federation | 115,775 | 50,418,997 | -21.3% | 35.9% |
| 5 | Iran | 20,269 | 31,155,709 | 243.6% | 127.9% |
| 6 | Canada | 266,196 | 30,694,053 | 9.8% | 3.7% |
| 7 | Australia | 183,427 | 26,028,438 | 11.1% | 4% |
| 8 | United Kingdom | 236,176 | 25,064,051 | 29.4% | 42.2% |
| 9 | Indonesia | 43,429 | 20,045,684 | 15.7% | 26.4% |
| 10 | France | 158,184 | 16,652,697 | 49.8% | 28.9% |
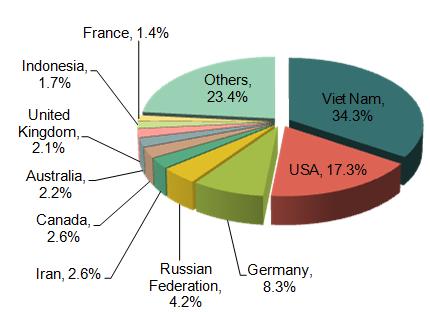
From January to September in 2014, China's main original export countries/regions of Machine-tools for working wood, hard plastics or similar hard materials are Vietnam, America, Russian federal, Iran, Canada, Australia, England, Indonesia, France etc. The export amount of Vietnam increased by 2487%,compared to the same period last year, becoming the biggest China's Machine-tools for working wood, hard plastics or similar hard materials' main export markets, accounting for 34.3% of the total amount.
Jan. to Sep. 2014, China Dividing Heads and Other Special Attachments for Machine-Tools (HS: 8466) Major Export Countries/Regions Distribution (Sort by Export Value)
| NO. | Countries/Regions | Jan.-Sep. | Compared to the same period last year | ||
| Volume | Value(USD) | Volume | Value | ||
| 1 | Japan | 89,496,332 | 200,812,227 | 67.7% | 44.2% |
| 2 | USA | 59,434,629 | 150,091,203 | 40.3% | 29.1% |
| 3 | Germany | 16,042,044 | 64,233,806 | 15% | 27.6% |
| 4 | Taiwan | 26,535,492 | 62,243,219 | 15.8% | 26.7% |
| 5 | Republic of Korea | 32,966,894 | 48,725,439 | 8.1% | 2.6% |
| 6 | Italy | 6,775,469 | 26,206,762 | 6.3% | 9% |
| 7 | India | 2,671,344 | 21,075,773 | -13.3% | 16.2% |
| 8 | Hong Kong | 1,379,950 | 19,325,419 | -11.7% | -2.2% |
| 9 | United Kingdom | 4,377,224 | 16,657,915 | -3.5% | -6% |
| 10 | Singapore | 5,067,218 | 15,597,210 | 12.8% | 11.4% |
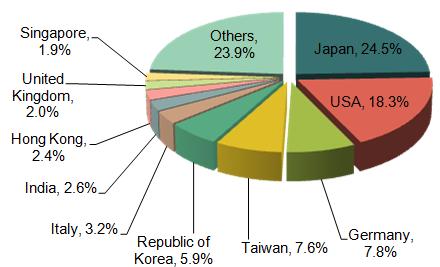
From January to September in 2014, China's main original export countries/regions of Machine-tools for mineral materials or for cold working glass are Japan, Germany, South Korea, American, Taiwan, Italy, India, Hong Kong , the UK and Singapore etc. Japan is the main export market of China's dividing heads and other special attachments for machine-tools, from January to September in 2014, accounting for 24.5% of the total amount of such products.
Data from: customs information network


