2008-2011 Chinese LED lamps (HS: 94054090) export trend analysis
At present, there are around 8000 LED companies in China, of which 80% are export-oriented. Under the influence of the economic crisis in Europe, the slump of the U.S. economic and many other factors, orders for LED has been declining since the second half of 2011.
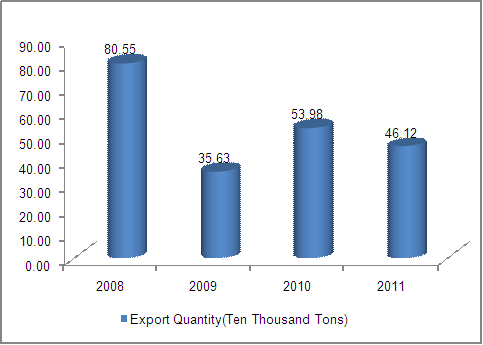
2008-2011 Chinese LED lamps export quantity

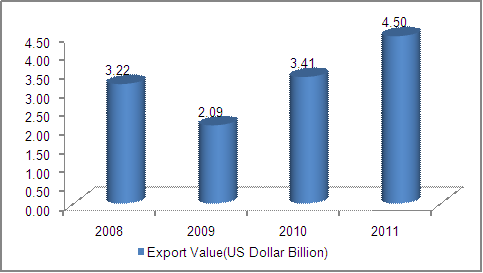
2008-2011 Chinese LED lamps export value

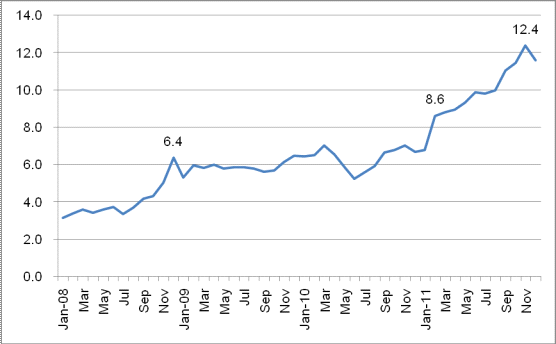
2008-2011 Chinese LED lamps average export unit price (USD/KG)

2008-2011 Chinese LED lamps export markets trend analysis
Major Chinese LED lamps Importers from 2008 to 2011.
| No. | Countries/Regions | Import Value(US Dollar Billion) | Amount in 2011 Compared with 2008 | |||
| 2011 | 2010 | 2009 | 2008 | |||
| 1 | USA | 10.31 | 8.61 | 5.04 | 7.25 | 42.20% |
| 2 | Japan↑ | 5.51 | 1.87 | 0.67 | 0.55 | 906.60% |
| 3 | Germany | 3.64 | 2.56 | 1.62 | 1.9 | 91.70% |
| 4 | HK | 2.55 | 1.84 | 0.85 | 1.27 | 101.20% |
| 5 | Netherlands↑ | 1.81 | 1.57 | 1.22 | 0.95 | 90.30% |
| 6 | United Kingdom | 1.67 | 1.56 | 1.06 | 1.35 | 24.10% |
| 7 | France | 1.61 | 1.5 | 0.8 | 0.82 | 97.00% |
| 8 | Canada | 1.26 | 1.12 | 0.69 | 1.03 | 22.90% |
| 9 | Italy | 1.18 | 1.05 | 0.67 | 0.7 | 68.20% |
| 10 | Australia | 1.18 | 0.95 | 0.63 | 0.72 | 62.30% |
Market Share of Major Chinese LED lamps Importers from 2008 to 2011.
| No. | Country/Region | Market Share | |||
|
|
| 2011 | 2010 | 2009 | 2008 |
| 1 | USA | 22.9% | 25.3% | 24.1% | 22.5% |
| 2 | Japan↑ | 12.3% | 5.5% | 3.2% | 1.7% |
| 3 | Germany | 8.1% | 7.5% | 7.8% | 5.9% |
| 4 | HK↑ | 5.7% | 5.4% | 4.1% | 3.9% |
| 5 | Netherlands | 4.0% | 4.6% | 5.8% | 2.9% |
| 6 | United Kingdom | 3.7% | 4.6% | 5.1% | 4.2% |
| 7 | France | 3.6% | 4.4% | 3.9% | 2.5% |
| 8 | Canada | 2.8% | 3.3% | 3.3% | 3.2% |
| 9 | Italy | 2.6% | 3.1% | 3.2% | 2.2% |
| 10 | Australia | 2.6% | 2.8% | 3.0% | 2.2% |
Note:“↑”indicates that the index grow continuously from 2008 to 2011.


