2011-2013 Japan Computer Industry Import Performance
2011-2013 Japan Computer Industry Import Value Annual Trend
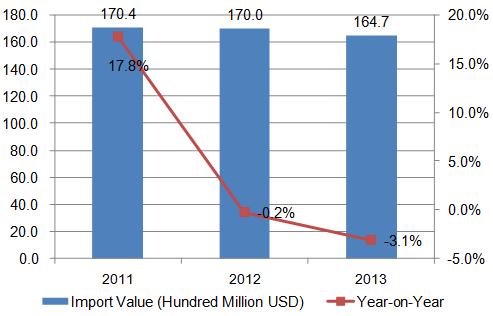
From 2011 to 2013 Japan's Computer import values are 170.4 billion US dollars, 170 billion US dollars and 164.7 billion US dollars, the imports value goes down with each passing year. The import value of 2013 declined 3.3% than 2011.
2011-2013 Japan Computer Industry Major Import Market Trend Analysis
| No. | Countries/ Regions | Import Value(USD) | Growth in 2013 compared with 2011 | ||
| 2011 | 2012 | 2013 | |||
| Total | 17,039,687 | 16,997,102 | 16,473,881 | -3.3% | |
| 1 | China | 12,758,966 | 13,079,585 | 13,133,803 | 2.9% |
| 2 | USA | 869,700 | 804,609 | 702,242 | -19.3% |
| 3 | Thailand | 702,615 | 742,242 | 604,798 | -13.9% |
| 4 | Singapore | 608,903 | 640,569 | 552,206 | -9.3% |
| 5 | Philippines | 325,825 | 331,669 | 321,103 | -1.4% |
| 6 | Taiwan | 214,276 | 256,847 | 261,516 | 22.0% |
| 7 | Malaysia | 321,616 | 264,950 | 227,545 | -29.2% |
| 8 | Republic of Korea | 434,529 | 293,023 | 164,428 | -62.2% |
| 9 | Germany | 91,554 | 90,122 | 92,485 | 1.0% |
| 10 | Mexico | 177,479 | 136,029 | 90,499 | -49.0% |
From 2013, China was Japan's largest original places of imported goods, followed by USA and Thailand.
2011-2013 Japan Computer Industry Major Import Market Share Trend Analysis
| No. | Countries/ Regions | Import Value Share | ||
| 2011 | 2012 | 2013 | ||
| 1 | China↑ | 74.9% | 77.0% | 79.7% |
| 2 | USA↓ | 5.1% | 4.7% | 4.3% |
| 3 | Thailand | 4.1% | 4.4% | 3.7% |
| 4 | Singapore | 3.6% | 3.8% | 3.4% |
| 5 | Philippines | 1.9% | 2.0% | 1.9% |
| 6 | Taiwan↑ | 1.3% | 1.5% | 1.6% |
| 7 | Malaysia↓ | 1.9% | 1.6% | 1.4% |
| 8 | Republic of Korea↓ | 2.6% | 1.7% | 1.0% |
| 9 | Germany | 0.5% | 0.5% | 0.6% |
| 10 | Mexico↓ | 1.0% | 0.8% | 0.5% |
Note: “↑”represents that the indicators listed, continued to increase from 2011 to 2013, “↓”represents that the indicators listed, continued to decrease from 2011 to 2013.
From 2011 to 2013, among the Japan's first ten import markets, the import value share of China and Taiwan has increased year by year, USA, Malaysia, Republic of Korea and Mexico has declined year by year.
2014 Japan Computer Industry Import Performance
| Countries/ Regions | 2014 Import Value(Thousand USD) | Year-on-Year | Share |
| Total | 16,844,637 | 2.3% | 100% |
| China | 13,352,648 | 1.7% | 79.3% |
| USA | 816,506 | 16.3% | 4.8% |
| Thailand | 582,032 | -3.8% | 3.5% |
| Singapore | 568,743 | 3.0% | 3.4% |
| Taiwan | 317,501 | 21.4% | 1.9% |
| Philippines | 270,187 | -15.9% | 1.6% |
| Malaysia | 199,983 | -12.1% | 1.2% |
| Mexico | 165,062 | 82.4% | 1.0% |
| Republic of Korea | 130,334 | -20.7% | 0.8% |
| Germany | 99,842 | 8.0% | 0.6% |
Japan Computer Industry Major Import Countries/Regions Distribution, from Jan. To Dec. 2014
From 2014, the Japan's total import value was 168.45 billion US dollars, which increased 2.3% year on year, China is still the Japan's main original places of imported goods; the imports from China to Japan accounted for 79.3% of the total.From 2014, the imports from Mexico to Japan increased 82.4% year on year,which grows fastest.


