From Jan. to Dec. 2014, Chinese Block and Hoist; Hoists and Winches Exporters Distribution (Rating from Exports Value) (HS: 8425)
| No. | Countries/Districts | Jan. - Dec. | Compared to the Same Period Last Year | ||
| Volume(Set) | Value(USD) | Volume | Value | ||
| 1 | USA | 18,738,224 | 613,951,683 | 2.7% | 11% |
| 2 | Japan | 3,071,072 | 112,158,777 | 27.4% | 30.4% |
| 3 | Germany | 2,545,046 | 90,888,116 | 18.5% | 21% |
| 4 | Singapore | 105,530 | 71,568,442 | 41.3% | 30.4% |
| 5 | Russian Federation | 2,351,950 | 69,134,131 | 4.5% | 1.6% |
| 6 | Australia | 1,211,132 | 66,084,740 | -6.6% | 27.6% |
| 7 | Korea | 905,236 | 60,571,273 | 20.3% | 29.2% |
| 8 | Canada | 1,844,567 | 49,206,135 | 20.2% | 4.3% |
| 9 | Brazil | 1,551,916 | 47,380,129 | 4.1% | 6.5% |
| 10 | Vietnam | 623,317 | 46,433,093 | 46.4% | 72.6% |
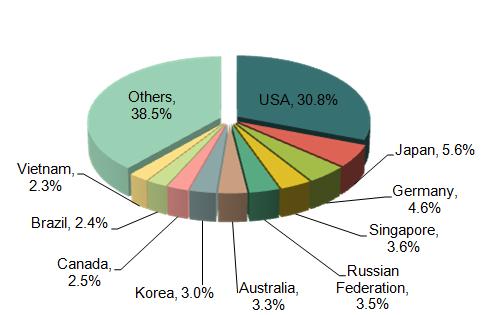
From the export data from Jan. to Dec. 2014, Chinese major export countries of Block and hoist; Hoists and winches are USA, Japan, Germany, Singapore, Russian Federation, Australia, Korea, Canada, Brazil and Vietnam etc. USA is the major export market, accounting for 30.8% of all. Besides USA, the export distribution of the others are scattered
From Jan. to Dec. 2014, Chinese Derricks Exporters Distribution (Rating from Exports Value) (HS: 8426)
| No. | Countries/Districts | Jan. - Dec. | Compared to the Same Period Last Year | ||
| Volume(Set) | Value(USD) | Volume | Value | ||
| 1 | Singapore | 526 | 272,136,890 | -18.1% | -23.2% |
| 2 | United Arab Emirates | 691 | 240,797,026 | 22.5% | 83% |
| 3 | USA | 4,445 | 219,405,751 | 30.8% | 24.8% |
| 4 | Malaysia | 734 | 194,783,771 | 26.1% | 41.7% |
| 5 | Indonesia | 1,202 | 193,536,927 | -6.1% | 0.4% |
| 6 | Vietnam | 723 | 190,167,265 | 32.4% | 142.3% |
| 7 | Korea | 591 | 171,347,445 | 22.6% | -11.1% |
| 8 | Brazil | 316 | 155,528,230 | -50.8% | -24.8% |
| 9 | Saudi Arabia | 385 | 151,636,621 | -22.2% | 204.1% |
| 10 | Netherlands | 71 | 137,994,480 | 10.9% | -8.8% |
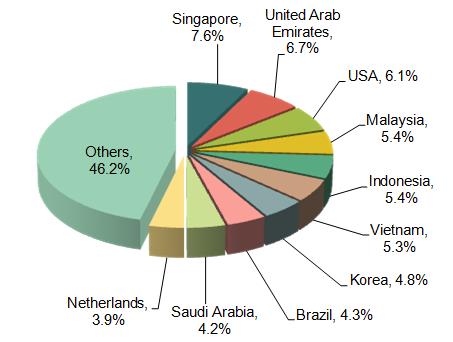
From the export data from Jan. to Dec. 2014, Chinese major export countries of derricks are Singapore, United Arab Emirates, USA, Malaysia, Indonesia, Vietnam, Korea, Brazil, Saudi Arabia and Netherlands etc. Singapore is the major export market, accounting for 7.6% of all. Among the ten biggest export markets, Chinese export value to Saudi Arabia increased by 204.1% at the fastest speed, compared to the same period of last year.
From Jan. to Dec. 2014, Chinese Fork-Lift Trucks Exporters Distribution (Rating from Exports Value) (HS: 8427)
| No. | Countries/Districts | Jan. - Dec. | Compared to the Same Period Last Year | ||
| Volume(Set) | Value(USD) | Volume | Value | ||
| 1 | USA | 472,096 | 244,376,486 | 13.5% | 22.9% |
| 2 | Australia | 36,647 | 116,822,822 | -0.8% | 30% |
| 3 | Netherlands | 42,216 | 101,082,094 | 20.3% | 38.8% |
| 4 | Turkey | 78,012 | 81,858,139 | -7.2% | 24.1% |
| 5 | Russian Federation | 94,618 | 77,796,923 | -8.9% | -20% |
| 6 | Brazil | 43,137 | 76,398,810 | -4.1% | -7.7% |
| 7 | Indonesia | 33,501 | 75,774,538 | -7.8% | 26.6% |
| 8 | Singapore | 14,397 | 60,296,622 | 13.7% | 41.3% |
| 9 | Thailand | 30,181 | 56,624,204 | -6% | -3.8% |
| 10 | Germany | 124,359 | 56,557,325 | -21.2% | 9.6% |
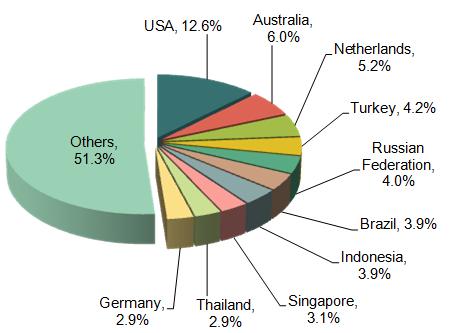
From the export data from Jan. to Dec. 2014, Chinese major export countries of derricks are USA, Australia, Netherlands, Turkey, Russian Federation, Brazil, Indonesia, Singapore, Thailand and Germany etc. Singapore is the major export market; accounting for 7.6% of all.USA is the main export market in 2014, accounting for 12.6%.
From Jan. to Dec. 2014, Chinese Major Lifting, Handling, Loading or Unloading Machinery Exporters Distribution (Rating from Exports Value) (HS: 8428)
| No. | Countries/Districts | Jan.-Dec. | Compared to the Same Period Last Year | ||
| Volume(Set) | Value(USD) | Volume | Value | ||
| 1 | Indonesia | 19,115 | 273,585,297 | 15.1% | 23.2% |
| 2 | Australia | 96,342 | 255,557,539 | 25.4% | 17% |
| 3 | Malaysia | 19,544 | 204,101,785 | 26% | -3.4% |
| 4 | Russian Federation | 41,172 | 192,913,306 | 21.2% | -0.4% |
| 5 | Brazil | 40,921 | 176,440,733 | -6.8% | 9.9% |
| 6 | Vietnam | 24,455 | 169,416,665 | 99.7% | -0.8% |
| 7 | India | 20,112 | 159,891,287 | 37.2% | -22.1% |
| 8 | Iran | 29,712 | 150,511,400 | -20.5% | 243.4% |
| 9 | USA | 528,539 | 147,562,791 | -18.4% | 22% |
| 10 | Singapore | 33,130 | 146,613,605 | 143.2% | 4.2% |
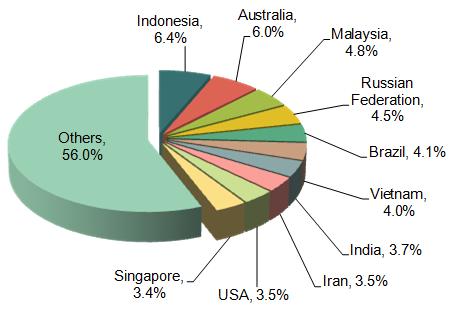
From the export data from Jan. to Dec. 2014, Chinese major export countries of lifting, handling, loading or unloading machinery are Indonesia, Australia, Malaysia, Russian Federation, Brazil, Vietnam, India, Iran, USA and Singapore etc. Indonesia is the major export market, accounting for 6.4% of all. Among the major ten biggest export markets, the export value of Iran increased by 243.4% at the fastest speed, compared to the same period of last year.
From Jan. to Dec. 2014, Chinese Major Bulldozers, Graders Exporters Distribution (Rating from Exports Value) (HS: 8429)
| No. | Countries/Districts | Jan. - Dec. | Compared to the Same Period Last Year | ||
| Volume(Set) | Value(USD) | Volume | Value | ||
| 1 | Russian Federation | 9,946 | 357,835,843 | -24% | -26.4% |
| 2 | Saudi Arabia | 3,084 | 248,969,456 | -4.4% | 41.6% |
| 3 | South Africa | 2,252 | 162,859,076 | -6.4% | 12.1% |
| 4 | Algeria | 2,514 | 159,109,867 | 30.9% | 47.8% |
| 5 | Kenya | 1,425 | 145,915,792 | 187.3% | 547.1% |
| 6 | Kazakhstan | 2,823 | 130,582,637 | -30.7% | -32.9% |
| 7 | Belgium | 1,056 | 103,205,852 | 78.4% | 95.3% |
| 8 | Philippines | 2,020 | 102,666,246 | 7.6% | 1.3% |
| 9 | Indonesia | 1,969 | 99,811,003 | -50% | -36% |
| 10 | Iran | 1,471 | 92,550,011 | 83.6% | 191.8% |
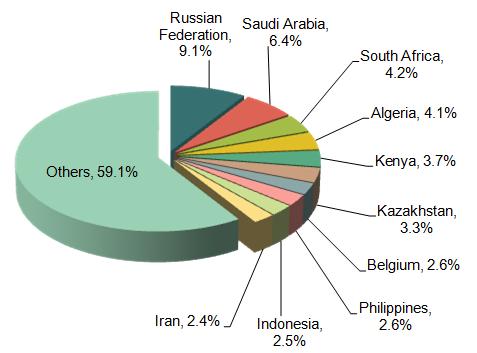
From the export data from Jan. to Dec. 2014, Chinese major export countries of Bulldozers, graders are Russian Federation, Saudi Arabia, South Africa, Algeria, Kenya, Kazakhstan, Belgium, Philippines, Indonesia and Iran etc. The export market of Bulldozers, graders is scattered, mostly locating in Russian Federation, Asian, African developing countries, each of them accounts for little share. From the export data from Jan. to Dec. 2014, Russian Federation is the major export market, accounting for 9.1% of all. In 2014, Chinese Bulldozers, graders export value to Kenya and Iran increased by 547.1%, 191.8% at fast speed.
From Jan. to Dec. 2014, Chinese Major Moving of Earth, Stone, Ores; Leveling Machines Exporters Distribution (Rating from Exports Value) (HS: 8430)
| No. | Countries/Districts | Jan. - Dec. | Compared to the Same Period Last Year | ||
| Volume(Set) | Value(USD) | Volume | Value | ||
| 1 | USA | 269,286 | 257,123,920 | 124.2% | -28% |
| 2 | Russian Federation | 159,730 | 250,477,900 | 30.6% | 46.6% |
| 3 | United Arab Emirates | 16,240 | 233,089,729 | -38.3% | 17.9% |
| 4 | Venezuela | 2,311 | 220,527,527 | -56% | 0.4% |
| 5 | Saudi Arabia | 10,401 | 176,068,385 | -21.2% | 85.2% |
| 6 | Iraq | 13,199 | 114,383,710 | -33.6% | -41.6% |
| 7 | Oman | 91 | 102,361,935 | -99.6% | 496.3% |
| 8 | Indonesia | 12,511 | 98,284,938 | -27.2% | -1.6% |
| 9 | Kuwait | 329 | 96,569,662 | -49.6% | 176.6% |
| 10 | Turkmenistan | 272 | 92,722,192 | 55.4% | 738.7% |
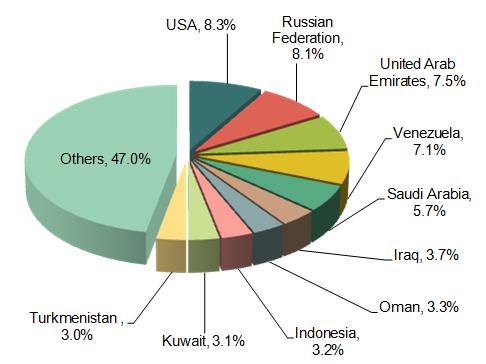
From the export data from Jan. to Dec. 2014, Chinese major export countries of Moving of Earth, Stone, Ores; Leveling Machines are USA, Russian Federation, United Arab Emirates, Venezuela, Saudi Arabia, Iraq, Oman, Indonesia, Kuwait and Turkmenistan etc.USA is the export market of Moving of Earth, Stone, Ores; Leveling Machines, accounting for 8.3%. Among the ten biggest export markets, Chinese Moving of Earth, Stone, Ores; Leveling Machines export value to Oman, Kuwait and Turkmenistan increased by 496.3%, 176.6% and 738.7% at faster speed, decreasing sharply compared to the last period.
From Jan. to Dec. 2014, Chinese Major Industrial Machinery Accessories Exporters Distribution (Rating from Exports Value) (HS: 8431)
| No. | Countries/Districts | Jan.-Dec. | Compared to the Same Period Last Year | ||
| Volume(Kg) | Value(USD) | Volume | Value | ||
| 1 | USA | 733,664,275 | 1,798,117,809 | 53.6% | 46.8% |
| 2 | Japan | 491,487,465 | 1,032,309,326 | 13.6% | 16.3% |
| 3 | Korea | 215,363,461 | 348,300,658 | -8.7% | -20.7% |
| 4 | Canada | 103,786,154 | 283,377,796 | 27% | 29.7% |
| 5 | Australia | 83,659,866 | 252,979,589 | 22.3% | 4.1% |
| 6 | Singapore | 48,707,045 | 230,853,075 | -10.3% | -5.2% |
| 7 | United Kingdom | 105,442,247 | 227,070,124 | 13.8% | 7.7% |
| 8 | Russian Federation | 48,671,146 | 199,040,353 | -1.2% | -1% |
| 9 | Brazil | 72,491,629 | 198,497,134 | 20.7% | 4.2% |
| 10 | India | 86,100,601 | 190,757,883 | 10.8% | -0.2% |
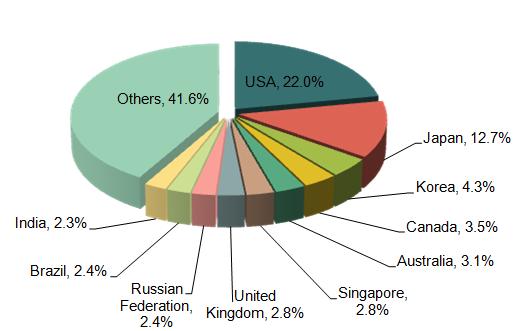
From the export data from Jan. to Dec. 2014, Chinese major export countries of Industrial machinery accessories are USA, Japan, Korea, Canada, Australia, Singapore, United Kingdom, Russian Federation, Brazil and India etc.USA is the export market of Industrial machinery accessories, accounting for 22% of all.
From Jan. to Dec. 2014, Chinese Major Sorting of Earth, Stone, Ores; Screening, Grinding, Mixing Machines Exporters Distribution (Rating from Exports Value) (HS: 8474)
| No. | Countries/Districts | Jan.-Dec. | Compared to the Same Period Last Year | ||
| Volume | Value(USD) | Volume | Value | ||
| 1 | Vietnam | 6,504,827 | 215,019,726 | -58.1% | 6.1% |
| 2 | Indonesia | 15,750,660 | 196,138,634 | 86.2% | -13.5% |
| 3 | USA | 36,741,607 | 167,598,075 | 12.5% | 10.5% |
| 4 | India | 9,039,663 | 158,739,689 | -20.6% | -24% |
| 5 | Iran | 1,591,944 | 157,203,272 | 60.6% | 31.5% |
| 6 | Russian Federation | 8,243,846 | 144,624,688 | 25.2% | -24.2% |
| 7 | Australia | 19,002,711 | 115,611,111 | 23.8% | 21% |
| 8 | Saudi Arabia | 9,642,770 | 103,923,597 | 4.2% | -4.7% |
| 9 | Kazakhstan | 4,060,578 | 101,810,438 | 39% | 86.5% |
| 10 | Malaysia | 6,396,628 | 90,990,993 | -22.3% | -25.1% |
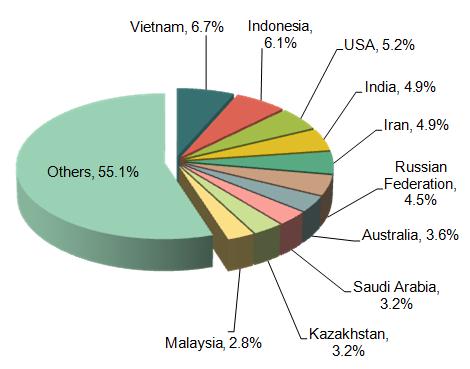
From the export data from Jan. to Dec. 2014, Chinese major export countries of sorting of earth, stone, ores; screening, grinding, mixing machines are Vietnam, Indonesia, USA, India, Iran, Russian Federation, Australia, Saudi Arabia, Kazakhstan and Malaysia etc. In 2014, Vietnam has become the main export market of sorting of earth, stone, ores; screening, grinding, mixing machines, overpassing Indonesia, accounting for 6.7%.
From Jan. to Dec. 2014, Chinese Major Special Purpose Motor Vehicles Exporters Distribution (Rating from Exports Value) (HS: 8705)
| No. | Countries/Districts | Jan.-Dec. | Compared to the Same Period Last Year | ||
| Volume(Set) | Value(USD) | Volume | Value | ||
| 1 | Algeria | 1,589 | 130,311,470 | 30.8% | 50.5% |
| 2 | Saudi Arabia | 757 | 121,709,264 | 44.7% | 37.2% |
| 3 | Kazakhstan | 705 | 81,792,190 | -37.1% | -18.5% |
| 4 | Russian Federation | 597 | 73,820,479 | -29.3% | -21.2% |
| 5 | Angola | 911 | 59,503,862 | 58.4% | 91.5% |
| 6 | Vietnam | 819 | 59,119,092 | 47.8% | 50.3% |
| 7 | Myanmar | 1,183 | 45,815,161 | 117.9% | 36.1% |
| 8 | Indonesia | 311 | 45,479,911 | -54.2% | -35.4% |
| 9 | Uzbekistan | 440 | 43,746,162 | 67.3% | 60% |
| 10 | Iraq | 248 | 42,299,929 | 8.3% | 39.3% |
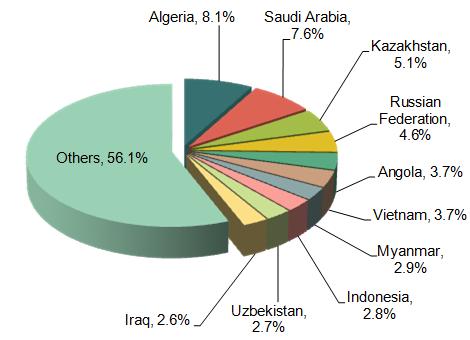
From the export data from Jan. to Dec. 2014, Chinese total export value of Special purpose motor vehicles is 1.6 billion dollars, decreasing by 6.8% compared to the last period. The main export countries are Algeria, Saudi Arabia, Kazakhstan, Russian Federation, Angola, Vietnam, Myanmar, Indonesia, Uzbekistan and Iraq. The export markets are scattered. The main export market is Angola, whose export value accounts for 8.1% of all.
Data from: The Customs Information Network


