China Monitor & Projector Export Volume and Value, from Jan. to Dec. 2014
| Month | Volume (Set) | Value (USD) | Compared to the Same Time of Last Year | |
| Volume | Value | |||
| Jan. | 26,752,066 | 2,520,651,532 | 32.6% | 33.4% |
| Feb. | 15,033,517 | 1,602,261,663 | -11.6% | -0.9% |
| Mar. | 23,387,626 | 2,340,469,198 | 0.6% | 9.1% |
| Apr. | 26,263,548 | 2,620,581,760 | 5.4% | 20.9% |
| May | 26,990,260 | 2,573,739,548 | 17.1% | 16.9% |
| Jun. | 24,385,757 | 2,274,516,988 | 17.4% | 9% |
| Jul. | 26,549,738 | 2,717,872,719 | 26.8% | 29.2% |
| Aug. | 28,163,019 | 2,830,994,983 | 28.5% | 24% |
| Sep. | 25,884,396 | 2,687,114,590 | 11% | 8.1% |
| Oct. | 29,248,917 | 2,999,347,578 | 13.4% | 10% |
| Nov. | 27,946,399 | 2,683,477,638 | 15.7% | 7.1% |
| Dec. | 26,595,114 | 2,474,242,570 | 5.2% | 1% |
| Total | 307,200,357 | 30,325,270,767 | 13.5% | 13.7% |
China Monitor & Projector export volume has reached 0.31 billion sets, from Jan. to Dec. 2014, increasing by 13.5% compared to the same period of last year. Its export value has reached 30.33 billion USD, increasing by 13.7%.
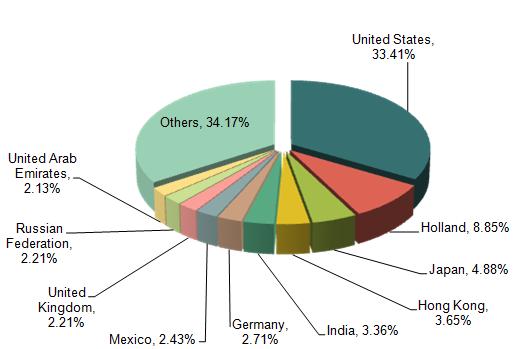
China Monitor & Projector Major Export Countries/Regions Distribution, from Jan. to Dec. 2014
| No. | Countries/Regions | Volume (Set) | Value (USD) | Compared to the Same Time of Last Year | |
| Volume | Value | ||||
| 1 | United States | 66,192,824 | 10,131,415,063 | 18.4% | 21.3% |
| 2 | Holland | 18,732,444 | 2,684,553,904 | 2.1% | 1.6% |
| 3 | Japan | 7,570,106 | 1,480,224,326 | 0.3% | -7.6% |
| 4 | Hong Kong | 16,310,952 | 1,106,588,348 | -12% | 2.1% |
| 5 | India | 20,068,154 | 1,018,519,683 | -9.3% | 19.5% |
| 6 | Germany | 7,203,818 | 820,330,452 | 24% | 27.9% |
| 7 | Mexico | 5,448,571 | 735,953,249 | 55.8% | 63.4% |
| 8 | United Kingdom | 6,388,224 | 670,367,135 | -11.6% | -9.7% |
| 9 | Russian Federation | 10,724,491 | 669,285,693 | 131.3% | 60.4% |
| 10 | United Arab Emirates | 12,816,540 | 646,697,050 | 16.5% | 0.1% |

The export data from Jan. to Dec. 2014 shows that China Monitor & Projector major export markets are the United States, Holland, Japan, Hong Kong, India, Germany, Mexico, United Kingdom, Russian Federation and United Arab Emirates.
The United States, Holland and Japan are still the top 3 export markets of Chinese Monitor & Projector, with export value separately accounting for 33.41%, 8.85% and 4.88% of the total export value of these particular products.
China Monitor & Projector Top Regions of Origin, from Jan. to Dec. 2014
| No. | Regions | Volume (Set) | Value (USD) | Compared to the Same Time of Last Year | |
| Volume | Value | ||||
| 1 | Guangdong | 163,116,045 | 13,710,906,600 | 20.8% | 24.8% |
| 2 | Jiangsu | 45,894,016 | 6,526,074,818 | 18.4% | 8.5% |
| 3 | Fujian | 43,026,592 | 4,171,628,262 | -9.8% | 2.9% |
| 4 | Shandong | 4,782,276 | 1,047,178,488 | 10.3% | -0.1% |
| 5 | Liaoning | 5,831,465 | 1,023,670,208 | 13.8% | -11.4% |
| 6 | Chongqing | 10,838,908 | 918,736,763 | 16.2% | 11% |
| 7 | Shanghai | 5,150,865 | 649,651,810 | 41.9% | 36% |
| 8 | Zhejiang | 4,732,857 | 573,401,072 | -17.2% | -27.9% |
| 9 | Tianjin | 2,884,902 | 428,986,145 | 33% | 36.9% |
| 10 | Hubei | 3,437,093 | 290,596,222 | -31.5% | -25.4% |
Guangdong is the top region of origin of Chinese Monitor & Projector. From Jan. to Dec. 2014, Guangdong’s total export volume of Monitor & Projector accounted for 53.10% of the total export volume of this particular product, with its export value accounting for 45.21%.


