2012 China No Forging of Cast Iron Products(HS:732510)Export
2012 China No Forging of Cast Iron Products Export Volume and Value
| Month | Volume(Kg) | Value(USD0 | Volume compared with last year | Value compared with last year |
| Jan. | 31,680,324 | 42,781,722 | -27.6% | -14.5% |
| Feb. | 17,026,103 | 22,000,251 | -12.4% | -7.5% |
| Mar. | 32,808,047 | 43,366,721 | 3.4% | 13.0% |
| Apr. | 33,929,966 | 44,589,906 | -20.2% | -15.3% |
| May | 38,111,815 | 49,855,037 | -16.5% | -12.7% |
| Jun. | 36,401,559 | 47,188,106 | -14.9% | -13.8% |
| Jul. | 28,108,382 | 37,802,631 | -14.2% | -10.9% |
| Aug. | 36,015,798 | 48,262,998 | 1.1% | 3.3% |
| Sep. | 31,512,081 | 41,572,546 | -8.2% | -6.6% |
| Oct. | 28,885,082 | 36,697,311 | -3.9% | -6.5% |
| Nov. | 33,477,573 | 42,995,443 | 11.4% | 2.5% |
| Dec. | 34,923,997 | 45,608,679 | -6.2% | -6.0% |
| Total | 382,880,727 | 502,721,351 | -10.1% | -6.9% |
The exports volume reached 383 thousands Tons at 2012, dropped 10.1% as before, and the export value reached $ 503 million, lost 6.9% as before. There are 3 months exports increased only in 2012
2012 China No Forging of Cast Iron Products Import Country and Region (Ranked by Export Value)
| No. | Country/Region | Total | Compared with the same period of 2011 | ||
|
|
| Volume(Kg) | Value(USD) | Volume | Value |
| 1 | Japan | 43,663,482 | 63,851,462 | 9.3% | 16.7% |
| 2 | Italy | 43,135,064 | 48,110,153 | -33.8% | -40.4% |
| 3 | USA | 22,948,976 | 45,071,740 | -0.4% | 9.0% |
| 4 | UK | 23,488,024 | 32,153,145 | -1.7% | -1.9% |
| 5 | Spain | 23,572,354 | 28,823,488 | -33.1% | -33.1% |
| 6 | Korea | 27,499,661 | 27,944,689 | -16.1% | -6.4% |
| 7 | Germany | 15,805,867 | 22,746,995 | -32.8% | -31.1% |
| 8 | Australia | 11,372,873 | 18,670,975 | 13.4% | 19.0% |
| 9 | Belgium | 13,265,435 | 15,712,753 | -4.0% | -11.8% |
| 10 | Canada | 10,564,970 | 14,534,015 | -1.2% | 12.2% |
| 11 | UAE | 10,651,901 | 12,423,290 | -14.8% | -11.8% |
| 12 | Taiwan | 11,754,263 | 11,606,180 | -14.5% | -21.7% |
| 13 | Morocco | 9,594,008 | 10,044,089 | -2.2% | 4.0% |
| 14 | HK | 10,398,960 | 9,515,219 | -2.1% | 8.4% |
| 15 | Saudi Arabia | 8,608,594 | 9,172,178 | 62.8% | 57.7% |
| 16 | Netherlands | 3,151,675 | 8,015,937 | -22.8% | -6.8% |
| 17 | Algeria | 8,092,097 | 7,999,037 | 1.7% | 3.5% |
| 18 | Malaysia | 6,080,839 | 7,650,547 | -19.1% | -14.2% |
| 19 | Israel | 5,941,899 | 6,364,571 | 28.1% | 33.6% |
| 20 | Singapore | 5,390,091 | 5,856,091 | 16.5% | 20.9% |
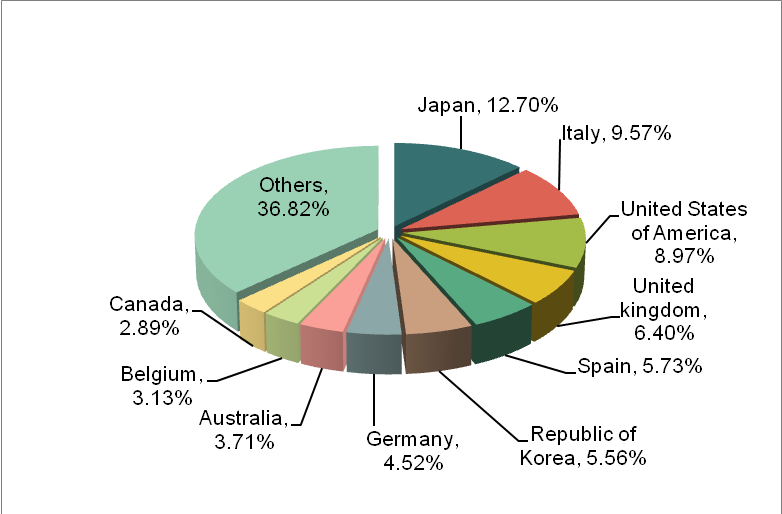
2012 mainly consumption market of China No forging of cast iron products included Japan, Italy, USA, UK, Spain, Korea, Germany, Australia, Belgium and Canada. Among them, Japan ranked the No.1, taken 12.7% rate of market, and the top ten exports countries shared 3/4 of whole market.
2012 China Major Original No Forging of Cast Iron Products Delivered Place
| No. | Region | Total | Compared with the same period of 2011 | ||
|
|
| Volume(Kg) | Value(USD) | Volume | Value |
| 1 | Hebei | 171,110,570 | 198,770,719 | -11.9% | -13.5% |
| 2 | Shandong | 59,770,504 | 94,347,505 | 4.1% | 11.7% |
| 3 | Jiangsu | 17,810,577 | 33,813,543 | 16.1% | 24.2% |
| 4 | Shanxi | 27,115,462 | 32,552,346 | -13.5% | -15.5% |
| 5 | Tainjin | 17,960,290 | 22,175,864 | -58.5% | -56.4% |
| 6 | Liaoning | 11,558,787 | 20,609,359 | 34.4% | 51.3% |
| 7 | Hunan | 18,588,394 | 20,098,146 | -4.7% | -13.0% |
| 8 | Shanghai | 13,621,254 | 19,107,533 | -5.9% | 3.4% |
| 9 | Guangdong | 17,201,589 | 17,854,563 | -13.6% | -3.4% |
| 10 | Beijing | 5,395,656 | 10,328,019 | 12.2% | 15.9% |
| 11 | Zhejiang | 4,300,318 | 10,089,548 | -2.0% | 16.2% |
| 12 | Henan | 2,602,560 | 4,815,247 | -25.5% | -13.8% |
| 13 | Shanxi | 2,131,775 | 3,158,333 | -26.6% | -23.6% |
| 14 | Anhui | 1,849,750 | 3,008,453 | 226.9% | 412.2% |
| 15 | Fujian | 2,479,855 | 2,944,856 | 75.0% | 41.7% |
| 16 | Hubei | 1,998,588 | 2,555,568 | 32.8% | 49.2% |
| 17 | Neimenggu | 4,533,238 | 1,282,216 | 3453.4% | 594.4% |
| 18 | Xinjiang | 529,284 | 1,103,090 | 24.2% | 88.9% |
| 19 | Guizhou | 632,869 | 1,072,205 | 26.7% | 27.1% |
| 20 | Guangzhou | 737,004 | 966,176 | -6.5% | 2.8% |
The major original no forging of cast iron products delivered places are Hebei, Shandong and Jiangsu.
2012 China Exports Analysis of Forging of Cast Iron Products, Grinding Balls and Similar Articles for Mills (HS: 732591)
2012 China Export Volume and Value of Forging of Cast Iron Products, Grinding Balls and Similar Articles for Mills
| Month | Volume(Kg) | Value(USD) | Volume compared with 2011 | Value compared with 2011 |
| Jan. | 4,056,317 | 6,139,487 | 25.7% | 79.3% |
| Feb. | 1,080,769 | 1,598,594 | -54.9% | -47.2% |
| Mar. | 3,284,042 | 4,227,534 | -38.7% | -32.5% |
| Apr. | 3,389,399 | 4,461,223 | -25.9% | -27.1% |
| May | 4,333,986 | 5,318,069 | 13.1% | 11.2% |
| Jun. | 3,258,265 | 4,431,150 | 41.2% | 59.2% |
| Jul. | 6,576,839 | 8,236,165 | 13.3% | 25.8% |
| Aug. | 3,250,886 | 4,040,241 | -26.8% | -26.4% |
| Sep. | 3,232,326 | 4,011,673 | -12.0% | -7.8% |
| Oct. | 4,355,564 | 5,448,843 | 8.8% | 7.3% |
| Nov. | 6,528,069 | 7,863,956 | 47.1% | 34.8% |
| Dec. | 5,188,659 | 7,461,059 | 26.3% | 33.3% |
| Total | 48,535,121 | 63,237,994 | 0.80% | 6.60% |
The exports volume reached 49 thousand Tons at 2012, took 0.8% growth only, and the export value reached $ 63 million, increased 6.6% as before.
2012 Import Country and Region for China Forging of Cast Iron Products, Grinding Balls and Similar Articles for Mills (Ranked by Export Value)
| No | Country/Region | Total | Compared with the same period of 2011 | ||
|
|
| Volume(Kg) | Value(USD) | Volume | Value |
| 1 | Japan | 4,745,987 | 6,009,589 | 1.0% | 5.4% |
| 2 | Vietnam | 3,075,402 | 5,503,976 | 119.4% | 355.8% |
| 3 | Pakistan | 4,300,950 | 4,382,436 | -25.5% | -28.0% |
| 4 | South Africa | 2,611,619 | 3,937,518 | -65.2% | -64.5% |
| 5 | Mongolia | 3,876,130 | 3,851,420 | 4113.2% | 6343.0% |
| 6 | Saudi Arabia | 2,218,210 | 2,931,375 | 333.2% | 478.4% |
| 7 | Tajikistan | 2,288,420 | 2,887,194 | 130.5% | 104.8% |
| 8 | Mozambique | 1,996,500 | 2,816,944 | -29.8% | -32.3% |
| 9 | Angola | 1,531,000 | 2,380,520 | 0.0% | 0.0% |
| 10 | Peru | 2,600,850 | 2,293,398 | -18.7% | -17.9% |
| 11 | Indonesia | 1,687,078 | 2,209,876 | -52.2% | -46.2% |
| 12 | Botswana | 1,640,000 | 2,149,100 | -55.2% | -53.1% |
| 13 | Kazakhstan | 1,053,837 | 1,954,726 | 723.3% | 533.0% |
| 14 | Brazil | 678,355 | 1,872,522 | 868.6% | 2510.9% |
| 15 | Myanmar | 1,885,756 | 1,763,482 | 74.6% | 95.4% |
| 16 | Turkey | 1,005,274 | 1,372,475 | 0.0% | 0.0% |
| 17 | Chile | 1,121,260 | 1,241,768 | 235.7% | 280.4% |
| 18 | Azerbaijan | 516,000 | 1,213,974 | 0.0% | 0.0% |
| 19 | Philippines | 1,069,590 | 1,168,206 | 150.6% | 206.1% |
| 20 | USA | 682,942 | 886,201 | -45.1% | -45.9% |
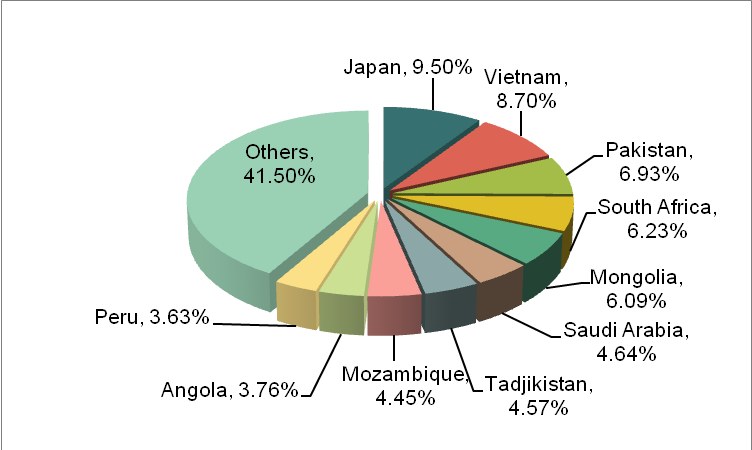
2012 mainly consumption market of China forging of cast iron products, Grinding balls and similar articles for mills included Japan, Vietnam, Pakistan, South Africa, Mongolia, Saudi Arabia, Tajikistan, Mozambique, Angola and Peru. Among them, Japan ranked the No.1, taken 9.5% rate of market, and the top ten exports countries shared 58.5% of whole market with dispersed export market.
2012 China Major Original Delivered Place for Forging of Cast Iron Products, Grinding Balls and Similar Articles for Mills
| No | Region | Total | Compared with the same period of 2011 | ||
|
|
| Volume(Kg) | Value(USD) | Volume | USD |
| 1 | Anhui | 21,415,281 | 29,316,843 | -23.9% | -22.9% |
| 2 | Liaoning | 5,717,761 | 5,348,779 | 38.2% | 26.1% |
| 3 | Shandong | 4,366,964 | 4,763,086 | -28.6% | -25.0% |
| 4 | Sichuan | 1,642,157 | 4,175,838 | 1264.9% | 4242.2% |
| 5 | Xinjiang | 2,166,840 | 2,739,328 | 116.1% | 90.2% |
| 6 | Jiangsu | 2,069,211 | 2,713,291 | 219.2% | 347.0% |
| 7 | Yunnan | 2,450,216 | 2,390,048 | 64.0% | 69.1% |
| 8 | Hebei | 1,399,145 | 2,372,769 | 273.2% | 497.9% |
| 9 | Beijing | 2,082,321 | 2,361,623 | 173.7% | 115.3% |
| 10 | Jiangxi | 1,362,082 | 2,336,490 | 15.0% | 76.6% |
| 11 | Shanghai | 1,265,001 | 1,040,493 | 5.0% | -34.2% |
| 12 | Guangdong | 446,755 | 832,583 | -62.7% | -5.5% |
| 13 | Hunan | 470,473 | 618,842 | 285.6% | 813.1% |
| 14 | Tianjin | 229,044 | 405,073 | 322.7% | 242.0% |
| 15 | Fujian | 160,640 | 377,764 | 405.9% | 330.4% |
| 16 | Henan | 286,740 | 290,016 | 48.6% | 50.3% |
| 17 | Shanxi | 142,179 | 249,298 | 0.0% | 0.0% |
| 18 | Neimengu | 321,320 | 243,056 | 6326.4% | 12052.8% |
| 19 | Guizhou | 115,000 | 183,258 | 0.0% | 0.0% |
| 20 | Guangxi | 132,500 | 152,109 | -32.6% | -17.1% |
The 2012 major original delivered places for forging of cast iron products, Grinding balls and similar articles for mills are ANHUI, LIAONING and JIANGSU, and export value from ANHUI took 46.4% as whole.
2012 China Other Cast Articles of Iron or Steel for Technical Use Export Analysis
2012 China Other Cast Articles of Iron or Steel for Technical Use Export Volume and Value
| Month | Volume(Kg) | Value(USD) | Volume compared with 2011 | Value compared with 2011 |
| Jan. | 8,519,038 | 13,983,782 | 16.7% | 18.1% |
| Feb. | 3,476,466 | 6,255,254 | 5.3% | 4.3% |
| Mar. | 8,033,664 | 14,318,016 | 33.4% | 42.9% |
| Apr. | 9,793,717 | 17,000,131 | 26.4% | 31.5% |
| May | 8,127,316 | 15,374,734 | 27.6% | 27.4% |
| Jun. | 8,116,740 | 14,288,326 | 14.7% | 15.3% |
| Jul. | 6,963,492 | 13,525,067 | -19.4% | 2.8% |
| Aug. | 10,527,146 | 16,166,420 | 30.9% | 5.8% |
| Sep. | 7,404,129 | 13,409,348 | -28.2% | -15.6% |
| Oct. | 6,564,475 | 10,247,676 | -8.5% | -11.1% |
| Nov. | 7,289,817 | 13,113,054 | -18.9% | -22.0% |
| Deb. | 7,564,696 | 12,706,514 | -32.3% | -27.9% |
| Total | 92,380,696 | 160,388,322 | 0.30% | 3.10% |
2012 China other cast articles of iron or steel for technical use exports volume reached 92 thousand Tons at 2012, took 0.3 % growth only, and the export value reached $ 160 million, increased 3.1% as before.
2012 Import Country/Region for China Other Cast Articles of Iron or Steel for Technical Use (Ranked by Export Value)
| No | Country/Region | Total | Compared with the same period of 2011 | ||
|
|
| Volume(Kg) | Value(USD) | Volume | Value |
| 1 | Korea | 20,252,631 | 28,409,829 | 14.9% | 4.7% |
| 2 | USA | 9,546,961 | 24,822,051 | 4.4% | 16.4% |
| 3 | Germany | 8,638,609 | 15,100,935 | 58.7% | 36.2% |
| 4 | Japan | 4,765,215 | 12,669,747 | 19.3% | 46.4% |
| 5 | Italy | 5,518,412 | 7,737,307 | -35.8% | -37.5% |
| 6 | Taiwan | 5,844,095 | 6,820,912 | -26.7% | -28.3% |
| 7 | Malaysia | 6,231,849 | 6,611,458 | 941.6% | 1115.1% |
| 8 | Australia | 2,701,333 | 6,305,475 | 13.5% | 46.4% |
| 9 | HK | 1,989,054 | 4,722,794 | 0.6% | 38.0% |
| 10 | France | 1,645,647 | 3,615,559 | -26.6% | -10.0% |
| 11 | Thailand | 1,730,736 | 2,683,190 | -11.7% | 20.6% |
| 12 | Canada | 1,225,568 | 2,521,383 | -26.3% | -24.4% |
| 13 | Netherland | 562,302 | 2,281,400 | 7.2% | 69.1% |
| 14 | UK | 861,834 | 2,267,423 | -23.8% | -15.8% |
| 15 | Denmark | 989,393 | 2,201,748 | 133.7% | 116.4% |
| 16 | South Africa | 777,797 | 1,897,127 | 16.5% | 31.2% |
| 17 | Bahrain | 1,615,539 | 1,838,009 | 27097.6% | 18825.1% |
| 18 | Vietnam | 740,760 | 1,829,080 | 127.3% | 294.8% |
| 19 | Spain | 1,100,729 | 1,790,366 | -67.6% | -61.1% |
| 20 | Singapore | 792,877 | 1,786,347 | -33.7% | -47.8% |
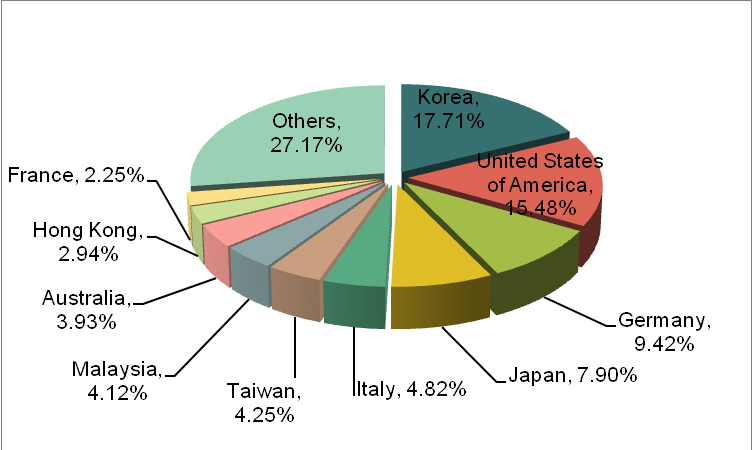
2012 mainly consumption market of China other cast articles of iron or steel for technical use included Korea, USA, Germany, Japan, Italy, Taiwan, Malaysia, Australia, HK and France. Among them, Korea ranked the No.1, taken 17.71% rate of market, and the top ten import countries shared 72.83% of whole market. In top twenty consumption markets, the export value rose more than 100% to Malaysia, Denmark, Bahrain and Vietnam with 1115.1%, 116.4%, 18825.1% and 294.8% growth separately.
2012 China Major Original Delivered Place for Other Cast Articles of Iron or Steel for Technical Use
| No | Region | Total | Compared with the same period of 2011 | ||
|
|
| Volume(Kg) | Value(USD) | Volume | Value |
| 1 | Shandong | 15,999,929 | 29,986,197 | -14.8% | -8.4% |
| 2 | Hebei | 21,601,368 | 27,776,775 | 63.1% | 43.8% |
| 3 | Jiangsu | 9,013,429 | 22,147,061 | -12.3% | -9.4% |
| 4 | Guangdong | 7,177,819 | 18,731,874 | -21.3% | -5.3% |
| 5 | Liaoning | 7,931,956 | 12,020,719 | 76.6% | 67.6% |
| 6 | Shanghai | 4,873,553 | 9,107,394 | 59.4% | 28.3% |
| 7 | Zhejiang | 2,578,580 | 8,083,305 | 19.7% | 42.4% |
| 8 | Tianjin | 4,838,977 | 7,354,124 | -47.1% | -28.3% |
| 9 | Shanxi | 4,383,213 | 6,019,257 | -35.3% | -28.3% |
| 10 | Shanxi | 4,541,869 | 4,676,500 | 54.0% | 34.1% |
| 11 | Fujian | 3,659,571 | 4,083,656 | -17.1% | -13.1% |
| 12 | Henan | 1,721,021 | 2,168,841 | 104.1% | 126.7% |
| 13 | Beijing | 455,484 | 1,446,617 | -48.7% | -25.8% |
| 14 | Chongqing | 230,203 | 1,148,284 | 11.6% | 534.3% |
| 15 | Sichuan | 362,978 | 1,075,592 | -84.5% | -78.5% |
| 16 | Hunan | 1,518,838 | 1,022,704 | 188.8% | 163.5% |
| 17 | Anhui | 465,544 | 800,494 | 126.7% | 148.5% |
| 18 | Gansu | 57,579 | 724,081 | 22.2% | 19.8% |
| 19 | Hubei | 323,005 | 720,179 | 80.6% | 122.6% |
| 20 | Jiangxi | 48,510 | 354,545 | -47.1% | -44.2% |
2012 China major original delivered place for other cast articles of iron or steel for technical use are SHANDONG, HEBEI and Jiangsu.
2012 China Cast, Molded, Stamped or Forged Copper Products Exports Analysis
2012 China Cast, Molded, Stamped or Forged Copper Products Export Volume and Value
| Month | Volume(Kg) | Value(USD) | Volume compared with last year | Value compared with last year |
| Jan. | 74,991 | 1,214,395 | 46.8% | 47.9% |
| Feb. | 49,192 | 928,052 | 85.8% | 115.4% |
| Mar. | 49,058 | 691,830 | -57.5% | -39.6% |
| Apr. | 69,441 | 737,311 | -13.0% | -34.5% |
| May | 79,319 | 698,849 | -4.9% | -24.0% |
| Jun. | 92,737 | 1,310,203 | 55.1% | 72.3% |
| Jul. | 76,249 | 849,636 | 51.8% | 13.5% |
| Aug. | 119,616 | 1,458,455 | 177.8% | 104.5% |
| Sep. | 91,659 | 1,312,439 | 79.2% | 100.1% |
| Oct. | 89,379 | 804,901 | 56.8% | 22.6% |
| Nov. | 69,328 | 904,160 | 47.3% | -1.7% |
| Dec. | 81,760 | 1,118,689 | -25.4% | -53.3% |
| Total | 942,729 | 12,028,920 | 21.80% | 6.50% |
2012 China Cast, molded, stamped or forged copper products export volume reached 943 Tons, took a 21.8% growth as before, and export value reached 12 million, increased 6.5% as before.
2012 China Cast, Molded, Stamped or Forged Copper Products Export Country and Region (Ranked by Export Value)
| No | Country/Region | Total | Compared with the same period of 2011 | ||
|
|
| Volume(Kg) | Value(USD) | Volume | Value |
| 1 | USA | 231,980 | 3,232,403 | 8.4% | 0.1% |
| 2 | Belarus | 57,750 | 1,495,745 | 2228.6% | 65.7% |
| 3 | Japan | 171,878 | 1,073,560 | 18.8% | -14.2% |
| 4 | HK | 52,627 | 698,602 | 220.8% | 206.0% |
| 5 | Thailand | 19,890 | 573,213 | 28.8% | -3.8% |
| 6 | Slovenia | 7,336 | 439,820 | 53.7% | 68.7% |
| 7 | Germany | 31,565 | 426,307 | -44.7% | -4.2% |
| 8 | Taiwan | 23,908 | 416,349 | -69.7% | -53.2% |
| 9 | India | 43,861 | 383,812 | 724.0% | 120.1% |
| 10 | UAE | 72,158 | 321,605 | 1621.3% | 1767.5% |
| 11 | Kenya | 15,518 | 228,864 | 698.3% | 1172.7% |
| 12 | Vietnam | 19,528 | 196,588 | -29.8% | -42.9% |
| 13 | Korea | 15,210 | 193,737 | -41.8% | -31.5% |
| 14 | UK | 15,823 | 192,194 | -33.7% | -41.9% |
| 15 | Russian | 25,187 | 174,634 | 92.2% | -9.2% |
| 16 | Australia | 8,644 | 154,315 | 79.5% | 54.8% |
| 17 | Malaysia | 3,354 | 147,604 | -42.7% | -18.0% |
| 18 | Iran | 10,488 | 128,533 | 48.6% | 36.7% |
| 19 | Indonesia | 13,582 | 125,739 | -27.2% | 30.7% |
| 20 | Congo (gold) | 10,360 | 114,500 | 19447.2% | 13531.0% |
2012 mainly consumption market of China Cast, molded, stamped or forged copper products included USA, Belarus, Japan, HK, Thailand, Slovenia , Germany, Taiwan, India and UAE. Among them, USA ranked the No.1, taken 26.87% rate of market, and the top ten import countries shared 75.33% of whole market. In 2012, the export value rose more than 100% to HK, India, UAE, Kenya and Congo (gold) with 206.0%, 120.1%, 1767.5%, 1172.7% and 13531.0% growth separately.
2012 China Major Original Delivered Place for China Cast, Molded, Stamped or Forged Copper Products
| No. | Region | Total | Compared with last year | ||
|
|
| Volume(Kg) | Value(USD) | Volume | Value |
| 1 | Zhejiang | 297,940 | 2,931,104 | 23.6% | -14.6% |
| 2 | Jiangsu | 219,800 | 2,363,278 | -7.6% | -15.2% |
| 3 | Shanghai | 87,265 | 2,047,370 | 50.2% | 50.6% |
| 4 | Shanxi | 30,625 | 1,291,137 | 597.3% | 38.3% |
| 5 | Shandong | 46,484 | 790,021 | 59.9% | 41.6% |
| 6 | Guangdong | 34,700 | 633,754 | -0.9% | -14.4% |
| 7 | Hebei | 79,603 | 459,097 | 4.9% | 21.0% |
| 8 | Liaoning | 30,586 | 402,872 | 73.5% | 24.5% |
| 9 | Henan | 30,000 | 263,549 | 1392.5% | 582.9% |
| 10 | Beijing | 15,984 | 234,362 | 62.9% | 250.6% |
| 11 | Tianjin | 22,360 | 207,046 | 80.6% | -7.1% |
| 12 | Fujian | 15,979 | 144,548 | -6.0% | 21.8% |
| 13 | Sichuan | 10,768 | 115,201 | -48.7% | -54.4% |
| 14 | Hubei | 6,785 | 65,715 | 480.9% | 369.1% |
| 15 | Jilin | 10,415 | 27,788 | 95.0% | 103.4% |
| 16 | Chongqin | 135 | 25,094 | 58.8% | 585.1% |
| 17 | Guangxi | 992 | 12,287 | 0.0% | 0.0% |
| 18 | Shanxi | 1,832 | 10,513 | 19.7% | -10.4% |
| 19 | Hunan | 359 | 2,910 | 0.0% | 0.0% |
| 20 | Heilongjiang | 102 | 1,167 | -76.0% | -60.0% |
2012 China major original delivered place for China Cast, molded, stamped or forged copper products are ZHEJIANG, JIANGSU and SHANGHAI.
Data Source: China Custom


