China Headgear and parts thereof exports trend from 2011 to 2014
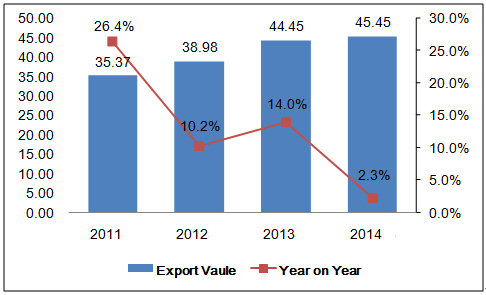
From the picture above, China headgear exports had a tendency to increase during this period. In 2014, the headgear export value was USD 4545 million, 28.5% higher than 2011.
China headgear export volume & value from Jan. to Sep. in 2015
| Month | Volume | Value(USD) | Y-O-Y | |
| Volume | Value | |||
| Jan. | 937,808,240 | 445,670,466 | -7.50% | 7.90% |
| Feb. | 813,554,649 | 401,737,446 | 51% | 107.60% |
| May. | 436,467,850 | 216,979,488 | -31.30% | -22.60% |
| Apr. | 827,685,441 | 337,832,981 | -7.70% | -3% |
| May. | 910,919,567 | 367,413,262 | -1% | 8.60% |
| Jun. | 882,787,983 | 405,653,138 | 4.90% | 6.30% |
| Jul. | 1,015,423,241 | 462,859,533 | 12.70% | -3.50% |
| Aug. | 1,024,998,600 | 508,977,416 | 10.30% | 0.50% |
| Sep. | 949,382,630 | 482,091,695 | 9.40% | 4.70% |
| Total | 7,799,028,201 | 3,629,215,425 | 3.40% | 6.70% |
From January to September in 2015, China headgear export value was USD 3629 million, up 6.7% by year.
Major regions for China’s headgear export from Jan. to Sep. in 2015
| No. | Country/Region | Volume | Value(USD) | Y-O-Y | |
| Volume | Value | ||||
| 1 | America | 2,299,508,123 | 976,974,973 | 16.50% | 17.30% |
| 2 | Japan | 302,494,120 | 227,902,969 | 10% | -1.70% |
| 3 | Germany | 335,629,134 | 167,624,018 | -6.10% | -7.30% |
| 4 | England | 395,205,947 | 155,255,159 | -5.10% | 1.40% |
| 5 | Russia | 104,868,768 | 135,739,665 | -33.50% | -47.20% |
| 6 | Korea | 72,654,295 | 127,269,331 | 1% | 44.10% |
| 7 | Hong Kong | 176,144,868 | 120,156,038 | -5.10% | 15.80% |
| 8 | Canada | 197,575,613 | 99,084,551 | 16.30% | 11.40% |
| 9 | Spain | 160,820,382 | 93,014,488 | 6.30% | 21.70% |
| 10 | Mexico | 177,193,000 | 91,904,761 | 21.40% | 28.90% |
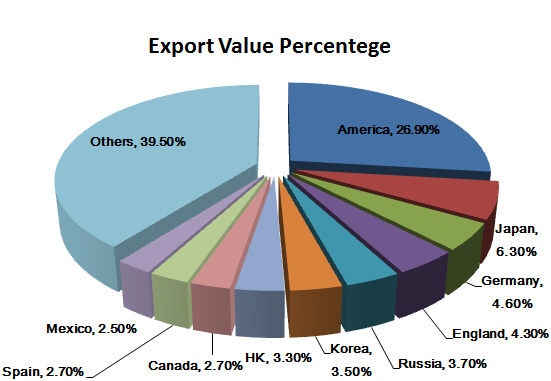
The export data shows that America, Japan, Germany, England, Russia, HK, Canada, Mexico and Spain. America, Japan and Germany topped the country list for China’s headgear export. China’s headgear export to Indian increased the fastest and the growth is 58.9%.
Distribution of China’s headgear origins from Jan. to Sep. in 2015
| No. | Region | Volume | Value | Y-O-Y | |
| Volume | Value | ||||
| 1 | Zhejiang | 802,412,374 | 1,041,827,107 | -4.70% | 25.50% |
| 2 | Guangdong | 996,979,328 | 743,954,429 | -10.20% | -2.50% |
| 3 | Jiangsu | 791,760,691 | 709,679,495 | 7.70% | 5.50% |
| 4 | Shanghai | 229,695,055 | 298,717,079 | -8.20% | -6% |
| 5 | Shandong | 363,302,440 | 257,717,782 | 17.50% | 11.50% |
| 6 | Hebei | 131,207,504 | 95,820,536 | 22.90% | 20.70% |
| 7 | Heilongjiang | 26,158,661 | 74,649,347 | -20.20% | -52.60% |
| 8 | Fujian | 30,555,734 | 74,067,779 | -10.40% | -0.90% |
| 9 | Hubei | 4,119,866,656 | 68,698,294 | 7.10% | 6.90% |
| 10 | Beijing | 3,116,172 | 34,875,514 | -44% | 14% |
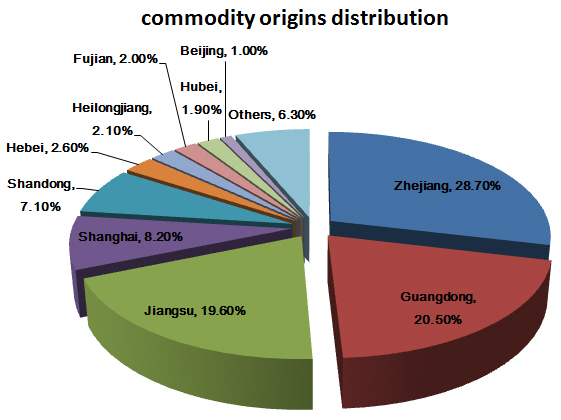
Zhejiang, Guangdong and Jiangsu are the major origins for China’s headgear export. The export volume from the three provinces accounted for 33.2% of the total. From January to September, Chongqing’s headgear export grew fastest and the growth was 295% by year. In the top 20 supply source, Beijing’s average price was the highest (11.19 USD/-) and Anhui’s was the lowest (0.08 USD/-)


