China Toy Export Volume and Value from Jan. to Sep. in 2013
| Month | Volume (-) | Value (USD) | Year-on-Year | |
|
|
|
| Volume | Value |
| January | 2,984,318,420 | 842,696,736 | 8.9% | 2.4% |
| February | 1,877,144,807 | 572,789,425 | 65.8% | 26.9% |
| March | 1,392,618,753 | 640,336,044 | -11.7% | -9.9% |
| April | 1,840,826,086 | 780,390,380 | 16.5% | 3.3% |
| May | 1,922,125,878 | 863,839,515 | 13.3% | -0.2% |
| June | 1,886,290,111 | 951,568,405 | 20.8% | 7.1% |
| July | 2,085,407,864 | 1,296,571,750 | 33.9% | 16.6% |
| August | 2,407,723,005 | 1,521,459,123 | 36.3% | 13.6% |
| September | 2,160,723,409 | 1,487,358,072 | 30.6% | -0.1% |
| Jan. to Sep. Total | 18,557,178,333 | 8,957,009,450 | 21.5% | 6.2% |
The export value of China toy from Jan. to September in 2013 amounted to 8.957 billion US dollars, with an increase of 6.2%.
China Toy Major Export Countries/Regions Distribution from Jan. to Sep. in 2013
| No. | Countries | Volume (-) | Value (USD) | Year-on-Year | |
|
|
|
|
| Volume | Volume |
| 1 | USA | 4,271,731,393 | 2,950,158,733 | 13.5% | 5.5% |
| 2 | Hong Kong | 951,828,725 | 659,937,837 | 0.3% | 10.1% |
| 3 | UK | 522,053,371 | 536,417,011 | 2.1% | 0.2% |
| 4 | Japan | 525,221,274 | 390,991,820 | -5% | 8.9% |
| 5 | Germany | 423,970,971 | 353,388,699 | 8% | 2% |
| 6 | Philippines | 731,911,414 | 324,665,186 | 1.7% | 2.9% |
| 7 | Singapore | 377,011,946 | 249,715,896 | 36.9% | 37.2% |
| 8 | France | 211,353,857 | 224,676,825 | -10.4% | -8.4% |
| 9 | The Russian Federation | 265,457,576 | 223,949,553 | 30.8% | 16.5% |
| 10 | Mexico | 513,896,741 | 216,803,416 | 25.7% | 11.2% |
| 11 | Canada | 222,842,114 | 212,373,391 | 17.2% | 7.1% |
| 12 | Australia | 236,522,817 | 204,035,116 | 12% | 3.9% |
| 13 | Netherlands | 366,120,574 | 186,742,699 | -13.2% | 5.1% |
| 14 | Belgium | 199,186,460 | 151,738,797 | 17.8% | 49.2% |
| 15 | South Korea | 175,332,506 | 146,994,025 | -3.3% | 18.3% |
| 16 | Spain | 205,384,904 | 134,389,352 | 23.7% | -3.5% |
| 17 | Italy | 265,419,837 | 131,059,486 | -8.3% | -14.2% |
| 18 | Brazil | 161,514,003 | 130,834,753 | -21.5% | 6.4% |
| 19 | Chile | 331,926,739 | 114,988,234 | 40.9% | 7.4% |
| 20 | UAE | 240,335,836 | 106,956,826 | -7.5% | -21.2% |
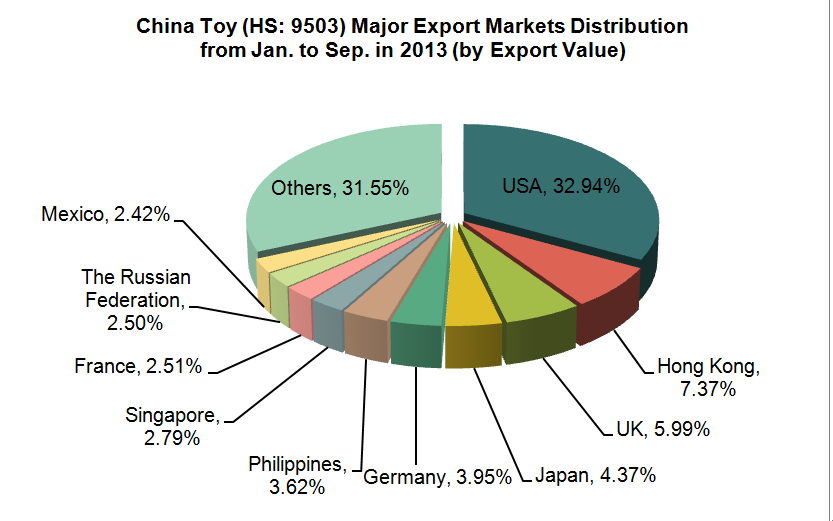
China's main export markets of toys were the United States, Hong Kong and Japan and etc. from Jan. to September in 2013. The export value to the United States accounted for 32.94% of our country's total export value of the product.
China Toy Export Source Areas from Jan. to Sep. in 2013
| No. | Regions | Volume (kg) | Value (USD) | Year-on-Year | |
|
|
|
|
| Volume | Volume |
| 1 | Guangdong | 7,298,206,871 | 6,131,707,517 | -7.6% | 5.4% |
| 2 | Zhejiang | 3,340,934,647 | 1,006,010,457 | 48.9% | 19% |
| 3 | Jiangsu | 2,078,085,916 | 765,472,620 | 7.8% | 1.3% |
| 4 | Shanghai | 174,633,223 | 260,247,639 | 5% | -8.6% |
| 5 | Shandong | 170,148,430 | 210,175,641 | 33.7% | -0.6% |
| 6 | Jiangxi | 195,557,005 | 193,244,338 | 39.7% | 41.9% |
| 7 | Fujian | 376,765,804 | 144,167,400 | 24.1% | -5.5% |
| 8 | Anhui | 89,566,143 | 132,994,409 | 2% | 4.9% |
| 9 | Guangxi Zhuang Autonomous Region | 145,152,352 | 23,025,546 | 70.3% | 58.4% |
| 10 | Henan | 62,876,046 | 20,908,436 | -4.5% | -17.8% |
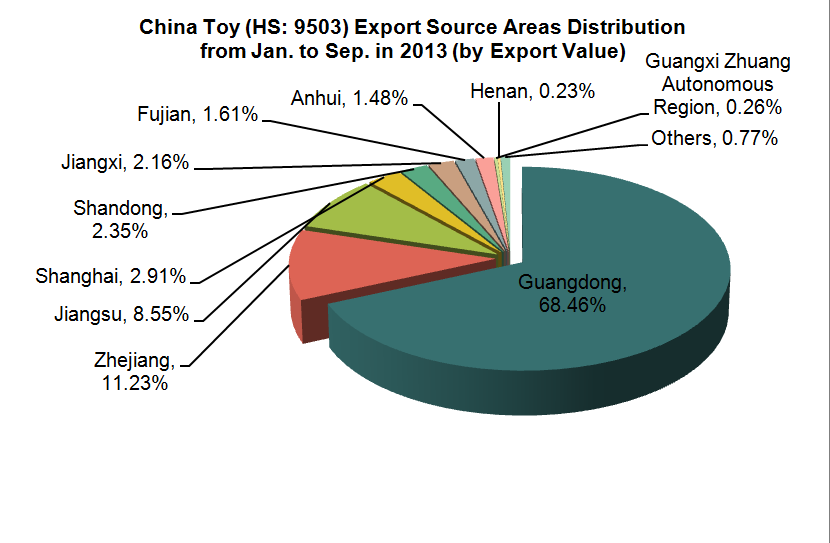
China toys were mainly exported from Guangdong, Zhejiang and Jiangsu from Jan. to September in 2013. among of which, the export value of Guangdong toys accounted for 68.46% of China's total export value of the product, and the export value of Zhejiang and Jiangsu accounted for 11.23% and 8.55% respectively of China's total export value of the product.
(Source: China Customs Network)


