2010-2012 Russian Federation Tubes, Pipes and Hollow Profiles, Seamless, of Iron or Steel Import Value Trend
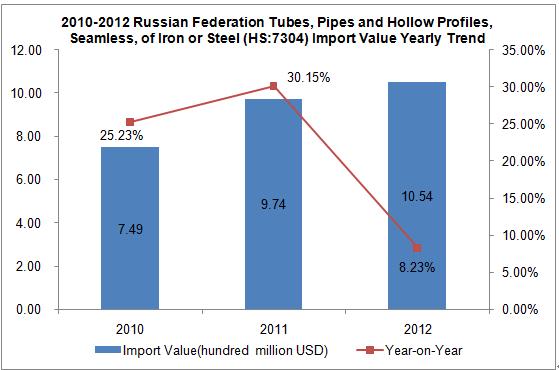
The Russian Federation's Tubes, Pipes and Hollow Profiles, Seamless, of Iron or Steel import value increased year on year from 2010 to 2012. The import value of 2012 amounted to 10.54billion US dollars, increased by 8.23% year on year.
2010-2012 Russian Federation Tubes, Pipes and Hollow Profiles, Seamless, of Iron or Steel Import Market Analysis
| No. | Import Countries/Regions | Import Value(Thousand USD) | 2012 Import Value Growth compared to 2010 | ||
| 2010 | 2011 | 2012 | |||
| 1 | Ukraine | 316,971 | 403,412 | 420,782 | 32.75% |
| 2 | China | 139,508 | 152,909 | 168,066 | 20.47% |
| 3 | Japan | 71,994 | 71,463 | 74,915 | 4.06% |
| 4 | USA | 29,616 | 40,382 | 49,350 | 66.63% |
| 5 | Germany | 41,540 | 54,928 | 49,118 | 18.24% |
| 6 | Mexico | 6,500 | 23,785 | 42,223 | 549.58% |
| 7 | Republic of Azerbaijan | 21,456 | 95,234 | 39,488 | 84.04% |
| 8 | Austria | 15,523 | 9,211 | 38,490 | 147.95% |
| 9 | Italy | 12,005 | 26,094 | 29,479 | 145.56% |
| 10 | France | 9,235 | 13,072 | 24,883 | 169.44% |
| 11 | Kazakhstan | 0 | 0 | 15,665 | / |
| 12 | Argentina | 15,464 | 7,240 | 13,125 | -15.13% |
| 13 | Malaysia | 517 | 6,180 | 13,004 | 2415.28% |
| 14 | Romania | 3,781 | 8,044 | 12,536 | 231.55% |
| 15 | Canada | 7,909 | 8,799 | 8,900 | 12.53% |
| 16 | Sweden | 6,421 | 7,158 | 7,436 | 15.81% |
| 17 | United Kingdom | 18,455 | 3,282 | 6,248 | -66.14% |
| 18 | Belarus | 0 | 0 | 5,694 | / |
| 19 | Indonesia | 70 | 146 | 3,898 | 5468.57% |
| 20 | Singapore | 1,387 | 9,167 | 3,451 | 148.81% |
From 2010 to 2012, Ukraine, China and Japan were the top three largest import markets, for the Russian Federation in Tubes, Pipes and Hollow Profiles, Seamless, of Iron or Steel. Among the Russian Federation top twenty Tubes, Pipes and Hollow Profiles, Seamless, of Iron or Steel import markets in 2012, the import value from Mexico, Austria, Italy, France, Malaysia, Romania, Indonesia and Singapore for Tubes, Pipes and Hollow Profiles, Seamless, of Iron or Steel increased by 549.58%, 147.95%, 145.56%, 169.44%, 2415.28%, 231.55%, 5468.57% and 148.81% compared to that of 2010, which increased quickly.
2010-2012 Russian Federation Tubes, Pipes and Hollow Profiles, Seamless, of Iron or Steel Import Market Share Analysis
| No. | Import Countries/Regions | Import Value Percentage | ||
| 2010 | 2011 | 2012 | ||
| 1 | Ukraine↓ | 42.34% | 41.40% | 39.90% |
| 2 | China | 18.64% | 15.69% | 15.94% |
| 3 | Japan ↓ | 9.62% | 7.33% | 7.10% |
| 4 | USA↑ | 3.96% | 4.14% | 4.68% |
| 5 | Germany | 5.55% | 5.64% | 4.66% |
| 6 | Mexico ↑ | 0.87% | 2.44% | 4.00% |
| 7 | Republic of Azerbaijan | 2.87% | 9.77% | 3.74% |
| 8 | Austria | 2.07% | 0.95% | 3.65% |
| 9 | Italy ↑ | 1.60% | 2.68% | 2.80% |
| 10 | France ↑ | 1.23% | 1.34% | 2.36% |
| 11 | Kazakhstan | 0.00% | 0.00% | 1.49% |
| 12 | Argentina | 2.07% | 0.74% | 1.24% |
| 13 | Malaysia↑ | 0.07% | 0.63% | 1.23% |
| 14 | Romania↑ | 0.51% | 0.83% | 1.19% |
| 15 | Canada↓ | 1.06% | 0.90% | 0.84% |
| 16 | Sweden↓ | 0.86% | 0.73% | 0.71% |
| 17 | United Kingdom | 2.47% | 0.34% | 0.59% |
| 18 | Belarus | 0.00% | 0.00% | 0.54% |
| 19 | Indonesia | 0.01% | 0.01% | 0.37% |
| 20 | Singapore | 0.19% | 0.94% | 0.33% |
Note: “↑”represents that the indicators listed continued to increase from 2010 to 2012“↓”represents that the indicators listed continued to decrease from 2010 to 2012.
Judging from the three year market share, the proportion of import value for USA, Mexico, Italy, France, Malaysia and Romania continued to rise, while only that of Ukraine, Japan, Canada and Sweden continued to decline.
Russian Federation Tubes, Pipes and Hollow Profiles, Seamless, of Iron or Steel Import from Jan. to Nov. 2013
| Countries/Regions | Total Imports (Thousand USD)from Jan. to Dec. 2013 | Year-on-Year | Percentage |
| Total | 1,257,554 | 19.83% | 100.00% |
| Ukraine | 344,411 | -18.15% | 27.39% |
| China | 333,130 | 99.39% | 26.49% |
| Japan | 114,863 | 93.43% | 9.13% |
| Kazakhstan | 73,014 | 1066.17% | 5.81% |
| USA | 54,796 | -23.56% | 4.36% |
| Austria | 54,222 | 47.60% | 4.31% |
| Germany | 52,000 | 14.96% | 4.14% |
| Republic of Azerbaijan | 37,665 | -8.68% | 3.00% |
| Mexico | 28,966 | 49.63% | 2.30% |
| Italy | 26,325 | -10.70% | 2.09% |
According to the data statistics from Jan. to Dec.2013, the total import value of Russian Federation Tubes, Pipes and Hollow Profiles, Seamless, of Iron or Steel amounted to 12.58 thousand USD, increased by 19.83% year on year. Ukraine was the first largest Original country of imported goods, amounted to 27.39% respectively of the total import value. The second largest Original country of imported goods was China, amounted to 26.49% respectively of the total import value.


