| No. | Countries/Regions | Export Value (hundred million USD) | Year on Year |
|
|
|
|
|
|
| Total | 202.18 | 11.7% |
| 1 | USA | 45.71 | -2.3% |
| 2 | Hong Kong | 16.59 | 67.9% |
| 3 | Japan | 12.94 | -3.5% |
| 4 | UK | 8.03 | -4.1% |
| 5 | Germany | 7.80 | 0.2% |
| 6 | The Russian Federation | 5.88 | 103.1% |
| 7 | France | 5.65 | 6.2% |
| 8 | Italy | 5.46 | -4.1% |
| 9 | Netherlands | 5.28 | 6.3% |
| 10 | Malaysia | 5.17 | 23.9% |
| 11 | Brazil | 4.60 | 10.8% |
| 12 | South Korea | 4.52 | 9.0% |
| 13 | Spain | 4.51 | -2.0% |
| 14 | Canada | 3.80 | 10.1% |
| 15 | UAE | 3.73 | 17.2% |
| 16 | India | 3.38 | 41.1% |
| 17 | Belgium | 3.25 | 0.2% |
| 18 | Singapore | 3.19 | 43.1% |
| 19 | Australia | 3.10 | 9.2% |
| 20 | South Africa | 2.92 | 28.4% |

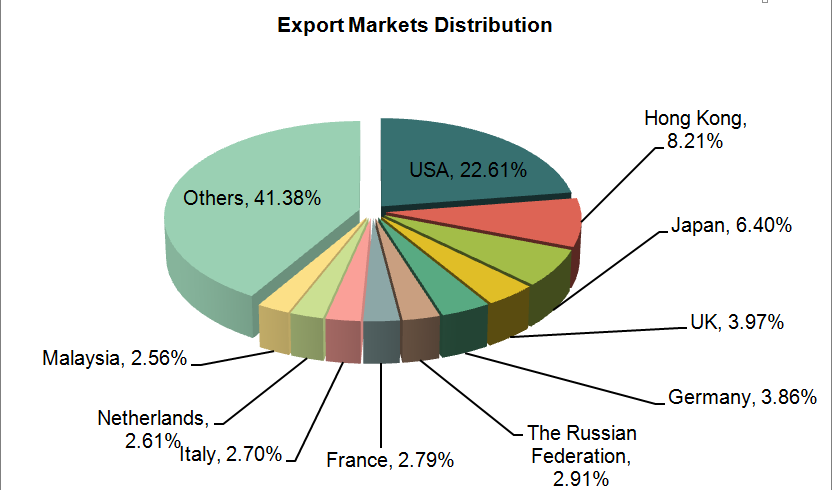
The total export value of China Bags, Cases & Boxes in the first three quarters of 2013 amounted to about 20.218 billion US dollars, with an increase of 11.7% year on year. Main export countries/regions are the United States, Hong Kong, Japan, the UK, Germany, The Russian Federation, France, Italy, Netherlands and Malaysia and so on. among of which, China's export value of the products to the Russian Federation from Jan. to Sep. increased by 103.1% year on year, and it was a rapid growth. China's export value of the products to the United States from Jan. to Sep. in 2013 accounted for 22.6% of the total export value, followed by Hong Kong, accounted for 8.2%.


