China Ceramic Building Bricks Export Analysis, from January to May, 2014
Export Amount and Value of China Ceramic Building Bricks, from January to May, 2014
| Month | Amount(KG) | Value(US dollars) | Compared to the same period last year | |
| Amount | Value | |||
| January | 50,741,101 | 141,406,413 | 66.9% | 316.5% |
| February | 16,861,056 | 30,780,539 | -22.5% | 36.4% |
| March | 32,665,198 | 54,771,414 | 48.9% | 262.4% |
| April | 47,974,043 | 69,315,272 | 7.2% | 159.3% |
| May | 65,129,266 | 76,753,008 | 49.4% | 170.4% |
| Cumulative Sum | 213,370,664 | 373,026,646 | 31.3% | 194.3% |
From January to May, 2014, the export amount of China ceramic building bricks is 213,400 tons, which has an increase of 31.3% compared to the same period last year; the export amount is 373 million US dollars, which has an increase of 194.3% compared to the same period last year.
Major Export Countries/ Regions Distribution of China Ceramic Building Bricks, from January to May, 2014
| No. | Country/ Region | Amount(KG) | Value(US dollars) | Compared to the same period last year | |
| Amount | Value | ||||
| 1 | Malaysia | 9,462,340 | 33,942,936 | 156.1% | 138.6% |
| 2 | Iran | 5,402,958 | 33,006,530 | 576.8% | 1348.7% |
| 3 | Indonesia | 12,247,227 | 29,024,781 | 1753.3% | 1636.4% |
| 4 | United Arab Emirates | 5,906,770 | 24,535,945 | 1223.8% | 1057.2% |
| 5 | India | 9,081,109 | 23,352,526 | 738.9% | 2128.2% |
| 6 | Saudi Arabia | 5,208,378 | 20,015,990 | 187.4% | 176.1% |
| 7 | Singapore | 3,756,123 | 15,285,960 | 357.2% | 346.6% |
| 8 | Angola | 33,900,817 | 12,570,799 | 3% | 48.8% |
| 9 | Thailand | 3,563,130 | 12,397,557 | 252.6% | 2649.4% |
| 10 | Vietnam | 2,892,153 | 10,223,078 | 46.6% | 663.8% |
| 11 | United States | 3,004,491 | 9,668,923 | 88.3% | 329.3% |
| 12 | Nigeria | 2,167,112 | 9,233,558 | 46.9% | 473.7% |
| 13 | Turkey | 1,206,666 | 6,236,784 | 2903.2% | 3571.1% |
| 14 | Japan | 10,845,168 | 5,878,752 | 13% | 98% |
| 15 | Cameroon | 915,737 | 5,697,912 | 115.7% | 726.4% |
| 16 | Philippines | 856,622 | 5,665,025 | 151.2% | 1099.8% |
| 17 | Kazakhstan | 1,184,840 | 5,521,510 | 23.3% | -10.9% |
| 18 | South Korea | 10,525,372 | 5,017,414 | -4.4% | 84.2% |
| 19 | Jordan | 1,436,459 | 4,849,143 | 557.3% | 529% |
| 20 | France | 1,315,715 | 4,844,251 | 1167.9% | 1393.4% |
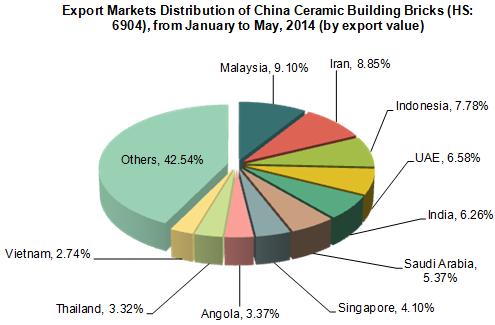
According to the exports data from January to May 2014, it can be seen that main export markets of China Ceramic Building Bricks are Malaysia, Iran, Indonesia, United Arab Emirates, India, Saudi Arabia, Singapore, Angola, Thailand, Vietnam and so on.
Malaysia, Iran and Indonesia are the top three export markets of China Ceramic Building Bricks. From January to May 2014, the export amount of China Ceramic Building Bricks to these three countries, respectively accounts for 9.1%, 8.85% and 7.78% of total exports about such products.
Original Places of Exported Goods of China Ceramic Building Bricks, from January to May
| No. | Region | Amount(KG) | Value(US dollars) | Compared to the same period last year | ||
| Amount | Value | |||||
| 1 | Guangdong | 100,379,515 | 252,350,919 | 133.6% | 419.8% | |
| 2 | Jiangxi | 34,709,896 | 28,343,694 | 41.7% | 193.6% | |
| 3 | Zhejiang | 12,207,439 | 24,419,536 | 0.7% | 10.1% | |
| 4 | Sichuan | 2,139,685 | 15,856,561 | 442% | 795.4% | |
| 5 | Xinjiang Uygur Autonomous Region | 4,580,447 | 11,287,914 | 36.8% | 29% | |
| 6 | Liaoning | 12,867,347 | 6,159,070 | 40.3% | -2.2% | |
| 7 | Gansu | 529,833 | 5,509,278 | 7512.5% | 11788% | |
| 8 | Fujian | 2,583,513 | 5,356,302 | -36.8% | 109.4% | |
| 9 | Shanxi | 545,645 | 4,359,588 | 754.7% | 1402.8% | |
| 10 | Jiangsu | 4,147,589 | 4,053,713 | 15.3% | 12% | |
According to the exports data from January to May 2014, it can be seen that original places of exported goods of China ceramic building bricks mainly concentrated in Guangdong Province. The export amount of Guangdong ceramic building bricks accounted for 67.65% of the total China exports of the product.
Compared to the same period last year, from January to May 2014, total export amount of Gansu ceramic building bricks reached 5.51 million US dollars, having an increase of 11,788%, growing rapidly.
Source: Customs Information Network
2014 Global Ceramic Building Bricks Import Analysis
Main Demand Countries/ Regions Import Value of Global Ceramic Building Bricks in First Quarter of 2014
| No. | Country/ Region | Cumulative Import Amount from Jan. To Mar. 2014 (thousand dollars) | Compared to the same period last year | |
| 1 | United Kingdom | 21,476 | 58.06% | |
| 2 | Germany | 18,322 | 155.82% | |
| 3 | The Russian Federation | 12,253 | 19.39% | |
| 4 | United States | 9,118 | -2.74% | |
| 5 | Belgium | 8,514 | 45.17% | |
| 6 | France | 5,717 | 6.42% | |
| 7 | Poland | 4,757 | 20.95% | |
| 8 | New Zealand | 3,451 | 26.27% | |
| 9 | Japan | 3,403 | -5.00% | |
| 10 | Peru | 3,195 | 4.34% |
From January to March 2014, the main importing countries of global Ceramic Building Bricks includes United Kingdom, Germany, the Russian Federation, United States, Belgium, France, Poland, New Zealand, Japan, Peru and so on. Among those countries, German import amount of Ceramic building bricks grew by 155.82% compared to the same period in 2013, grew rapidly.


